The interface
On this page 17
What the product actually looks like. Every image on this page is captured
from the running application by buddy docs:screenshots, not drawn, so it
shows the real interface with real records behind it.
The public pages render the demonstration field. The console pages render a development holding, Domäne Erlensee, with seeded flights.
The public site
Home
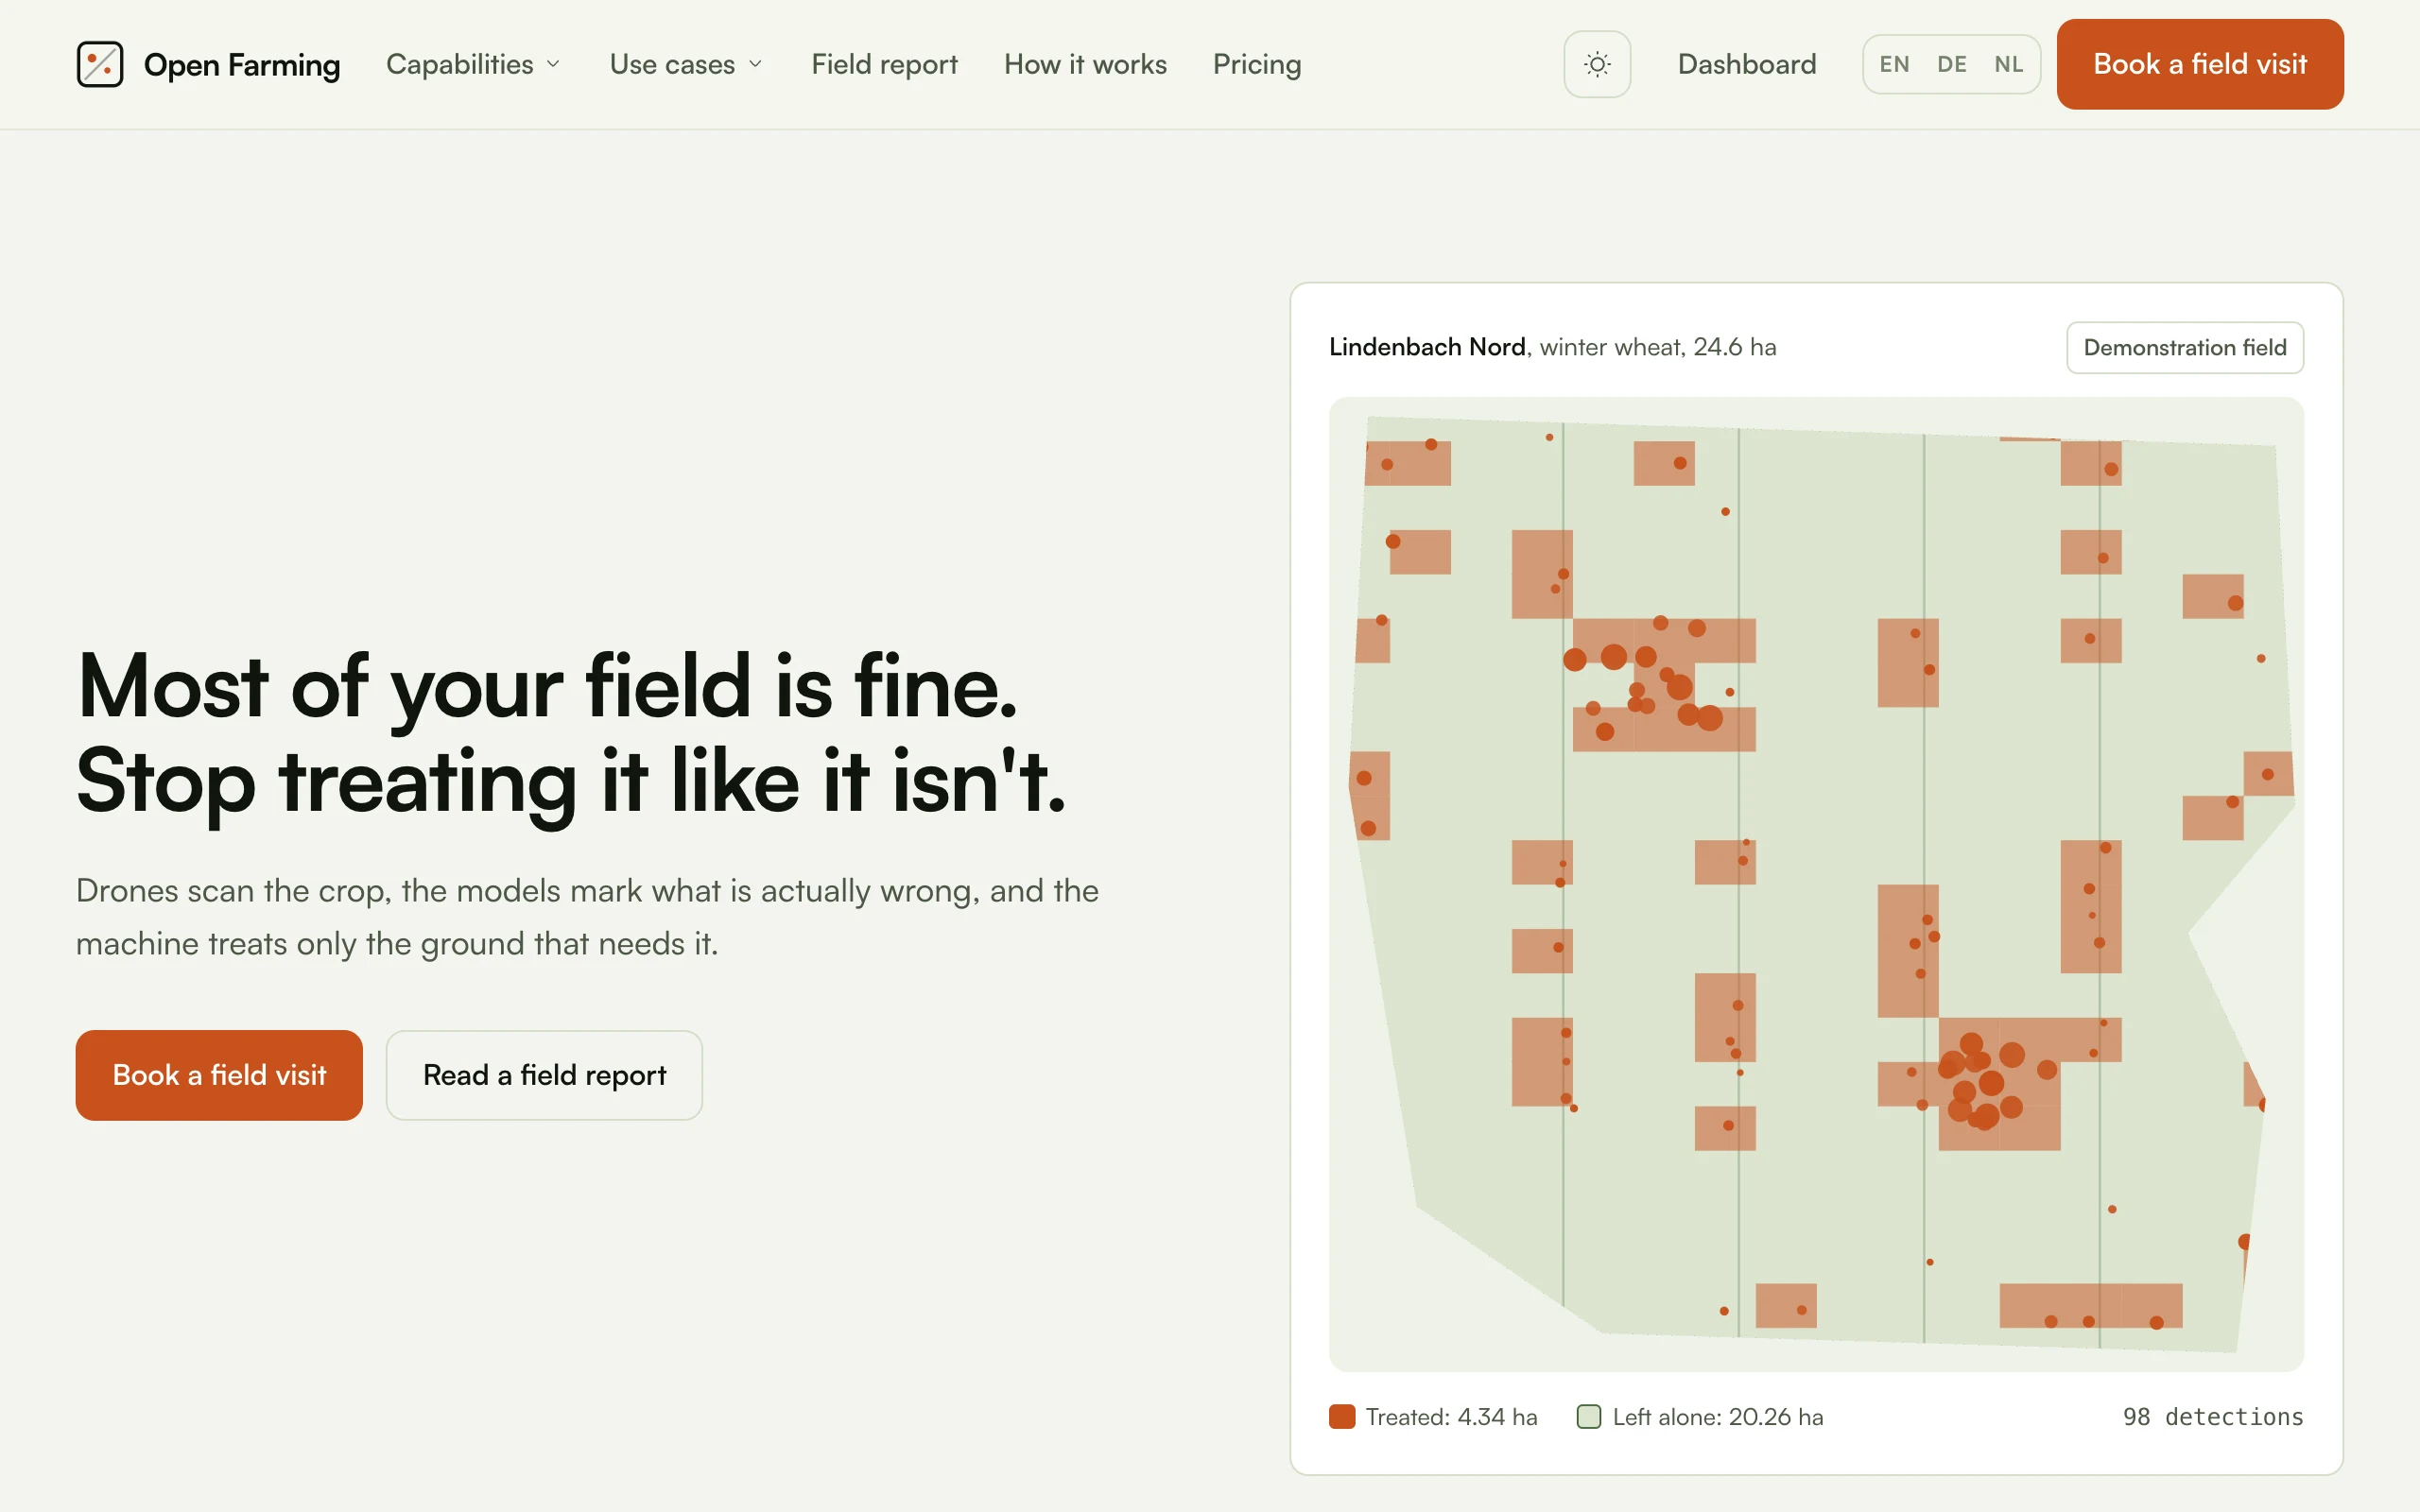
The argument and the evidence, side by side. The map on the right is not an
illustration: it is renderFieldMap drawing the stored
flight record, so the orange cells are the 62 rows of the prescription and the
dots are the 98 detections. The footer reads Treated: 4.34 ha, Left alone:
20.26 ha, and the chip in the corner says Demonstration field, because
every surface that shows these numbers has to say where they came from.
The loop, in three steps
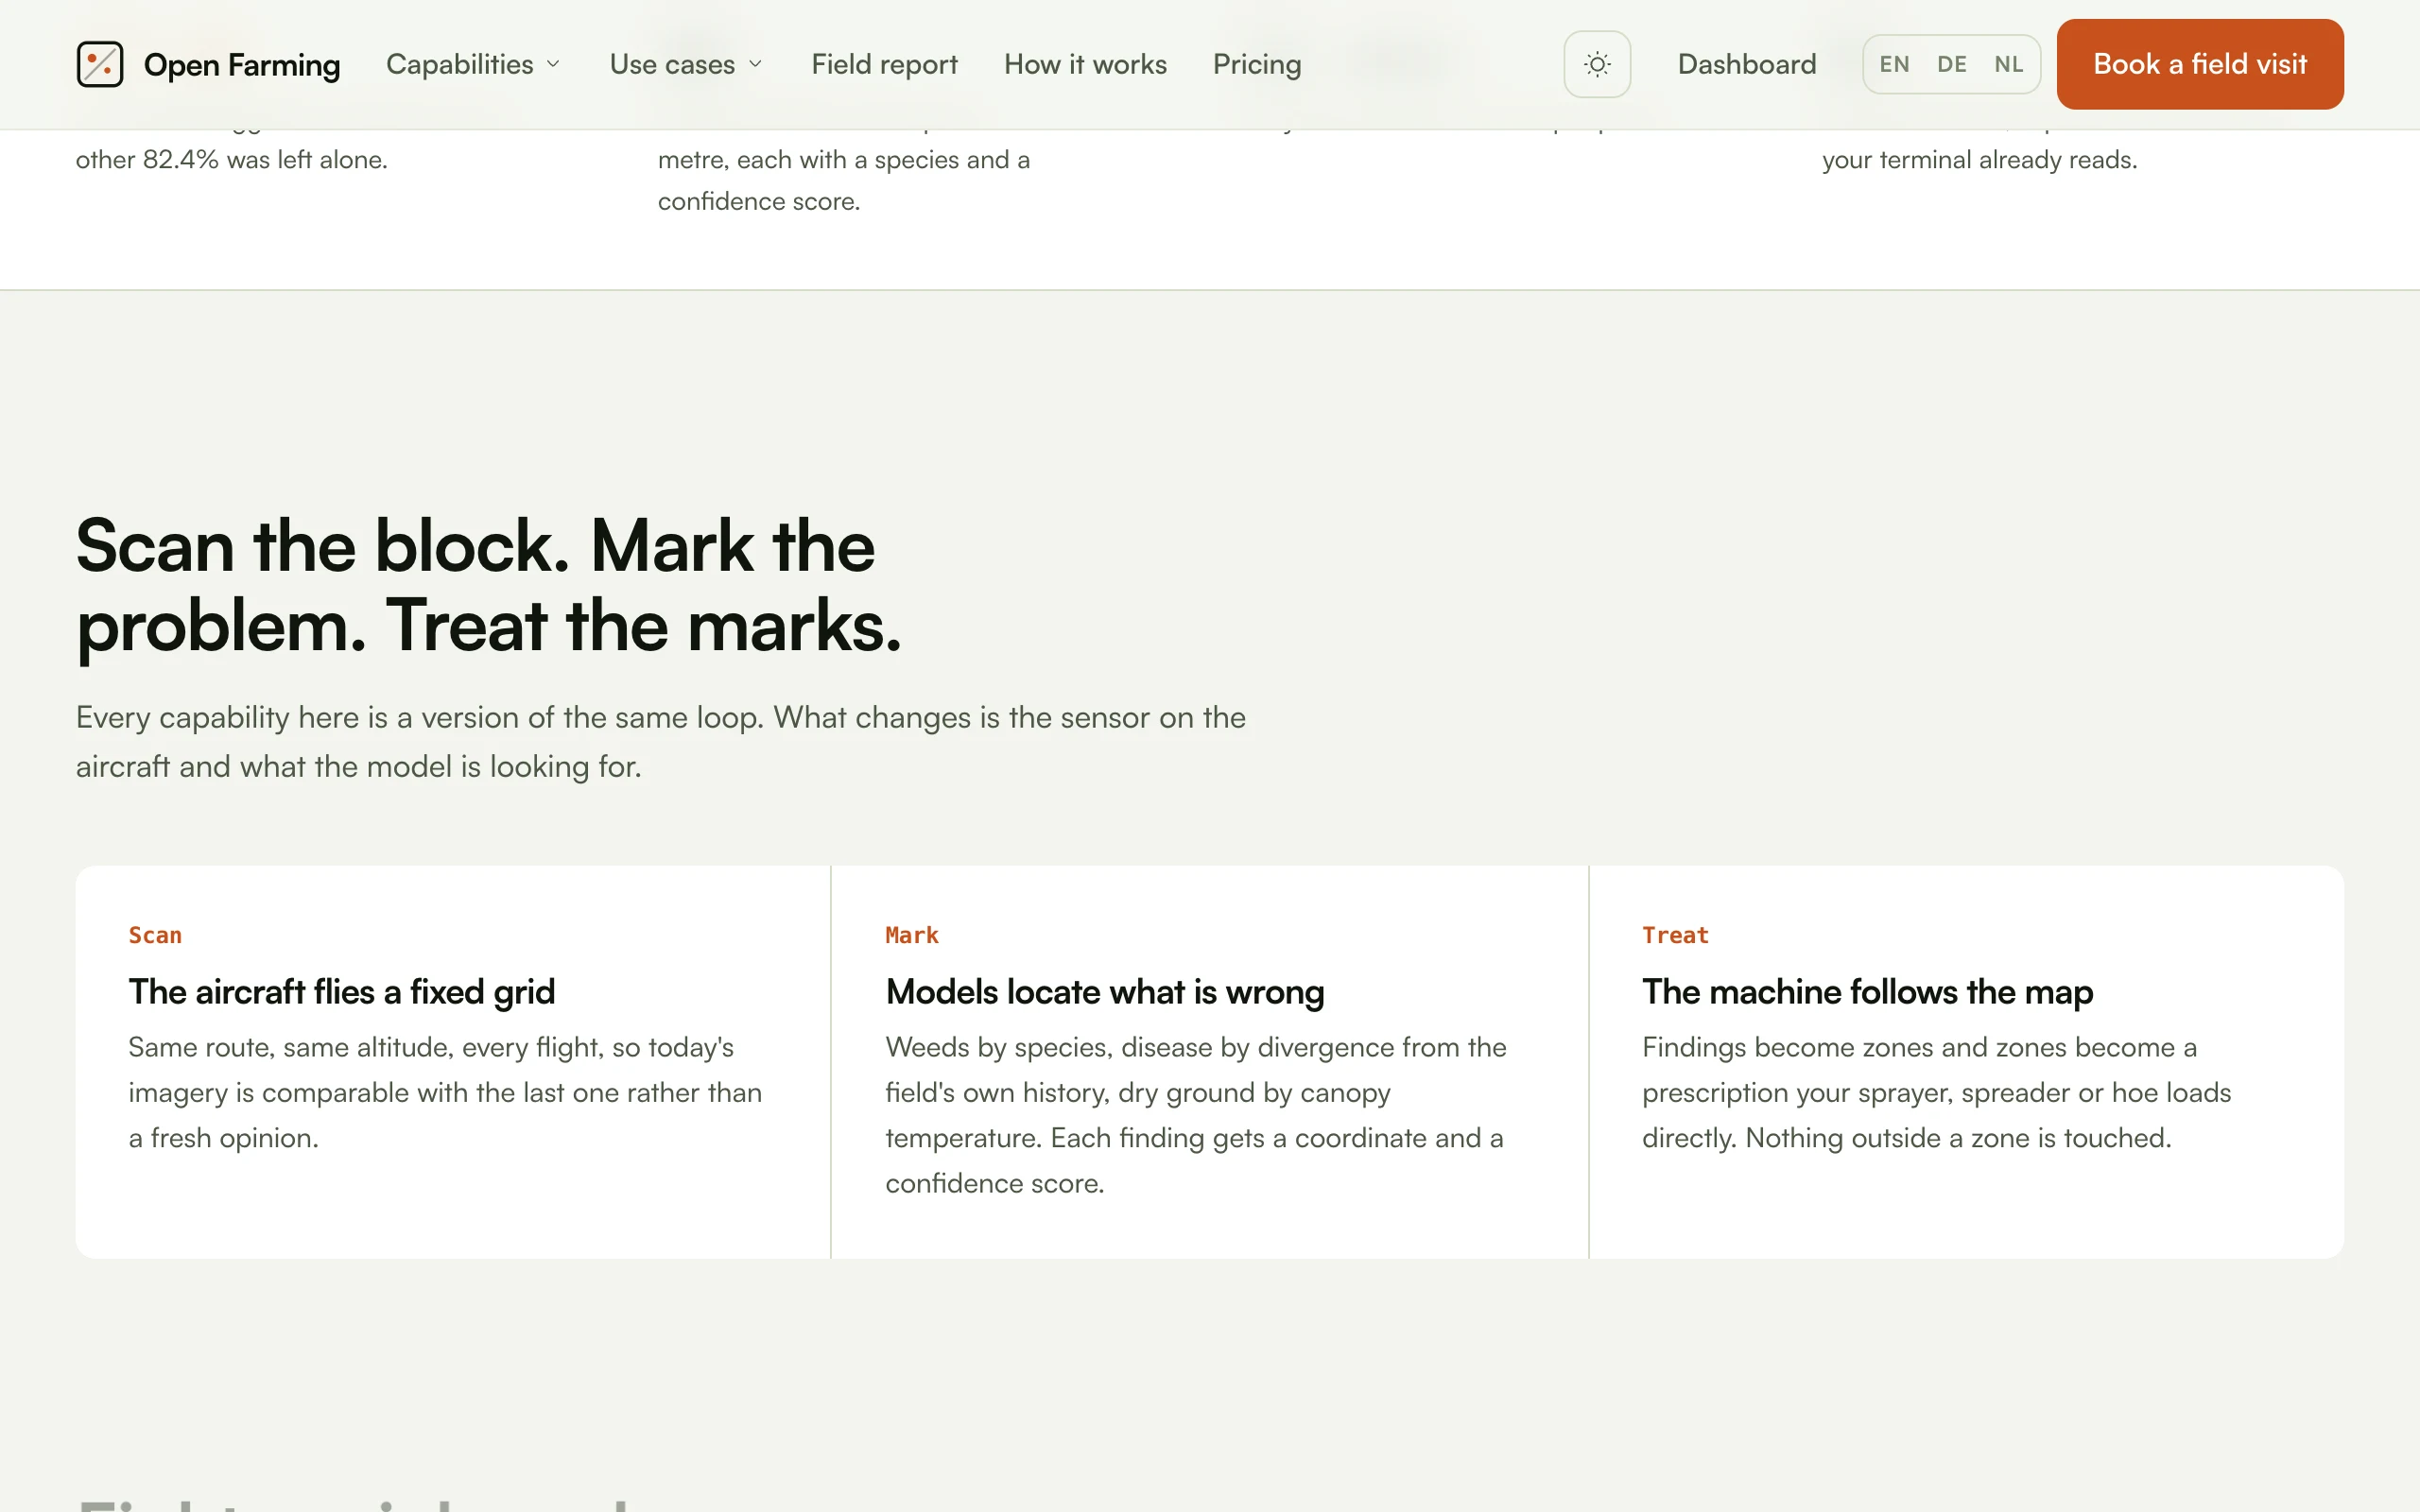
Further down the same page. This is the whole product in three sentences, and the order matters: the aircraft flies a fixed grid so today's imagery is comparable with the last flight rather than a fresh opinion, the models locate the problem, and the machine that is already permitted to treat the field follows the map.
Capabilities
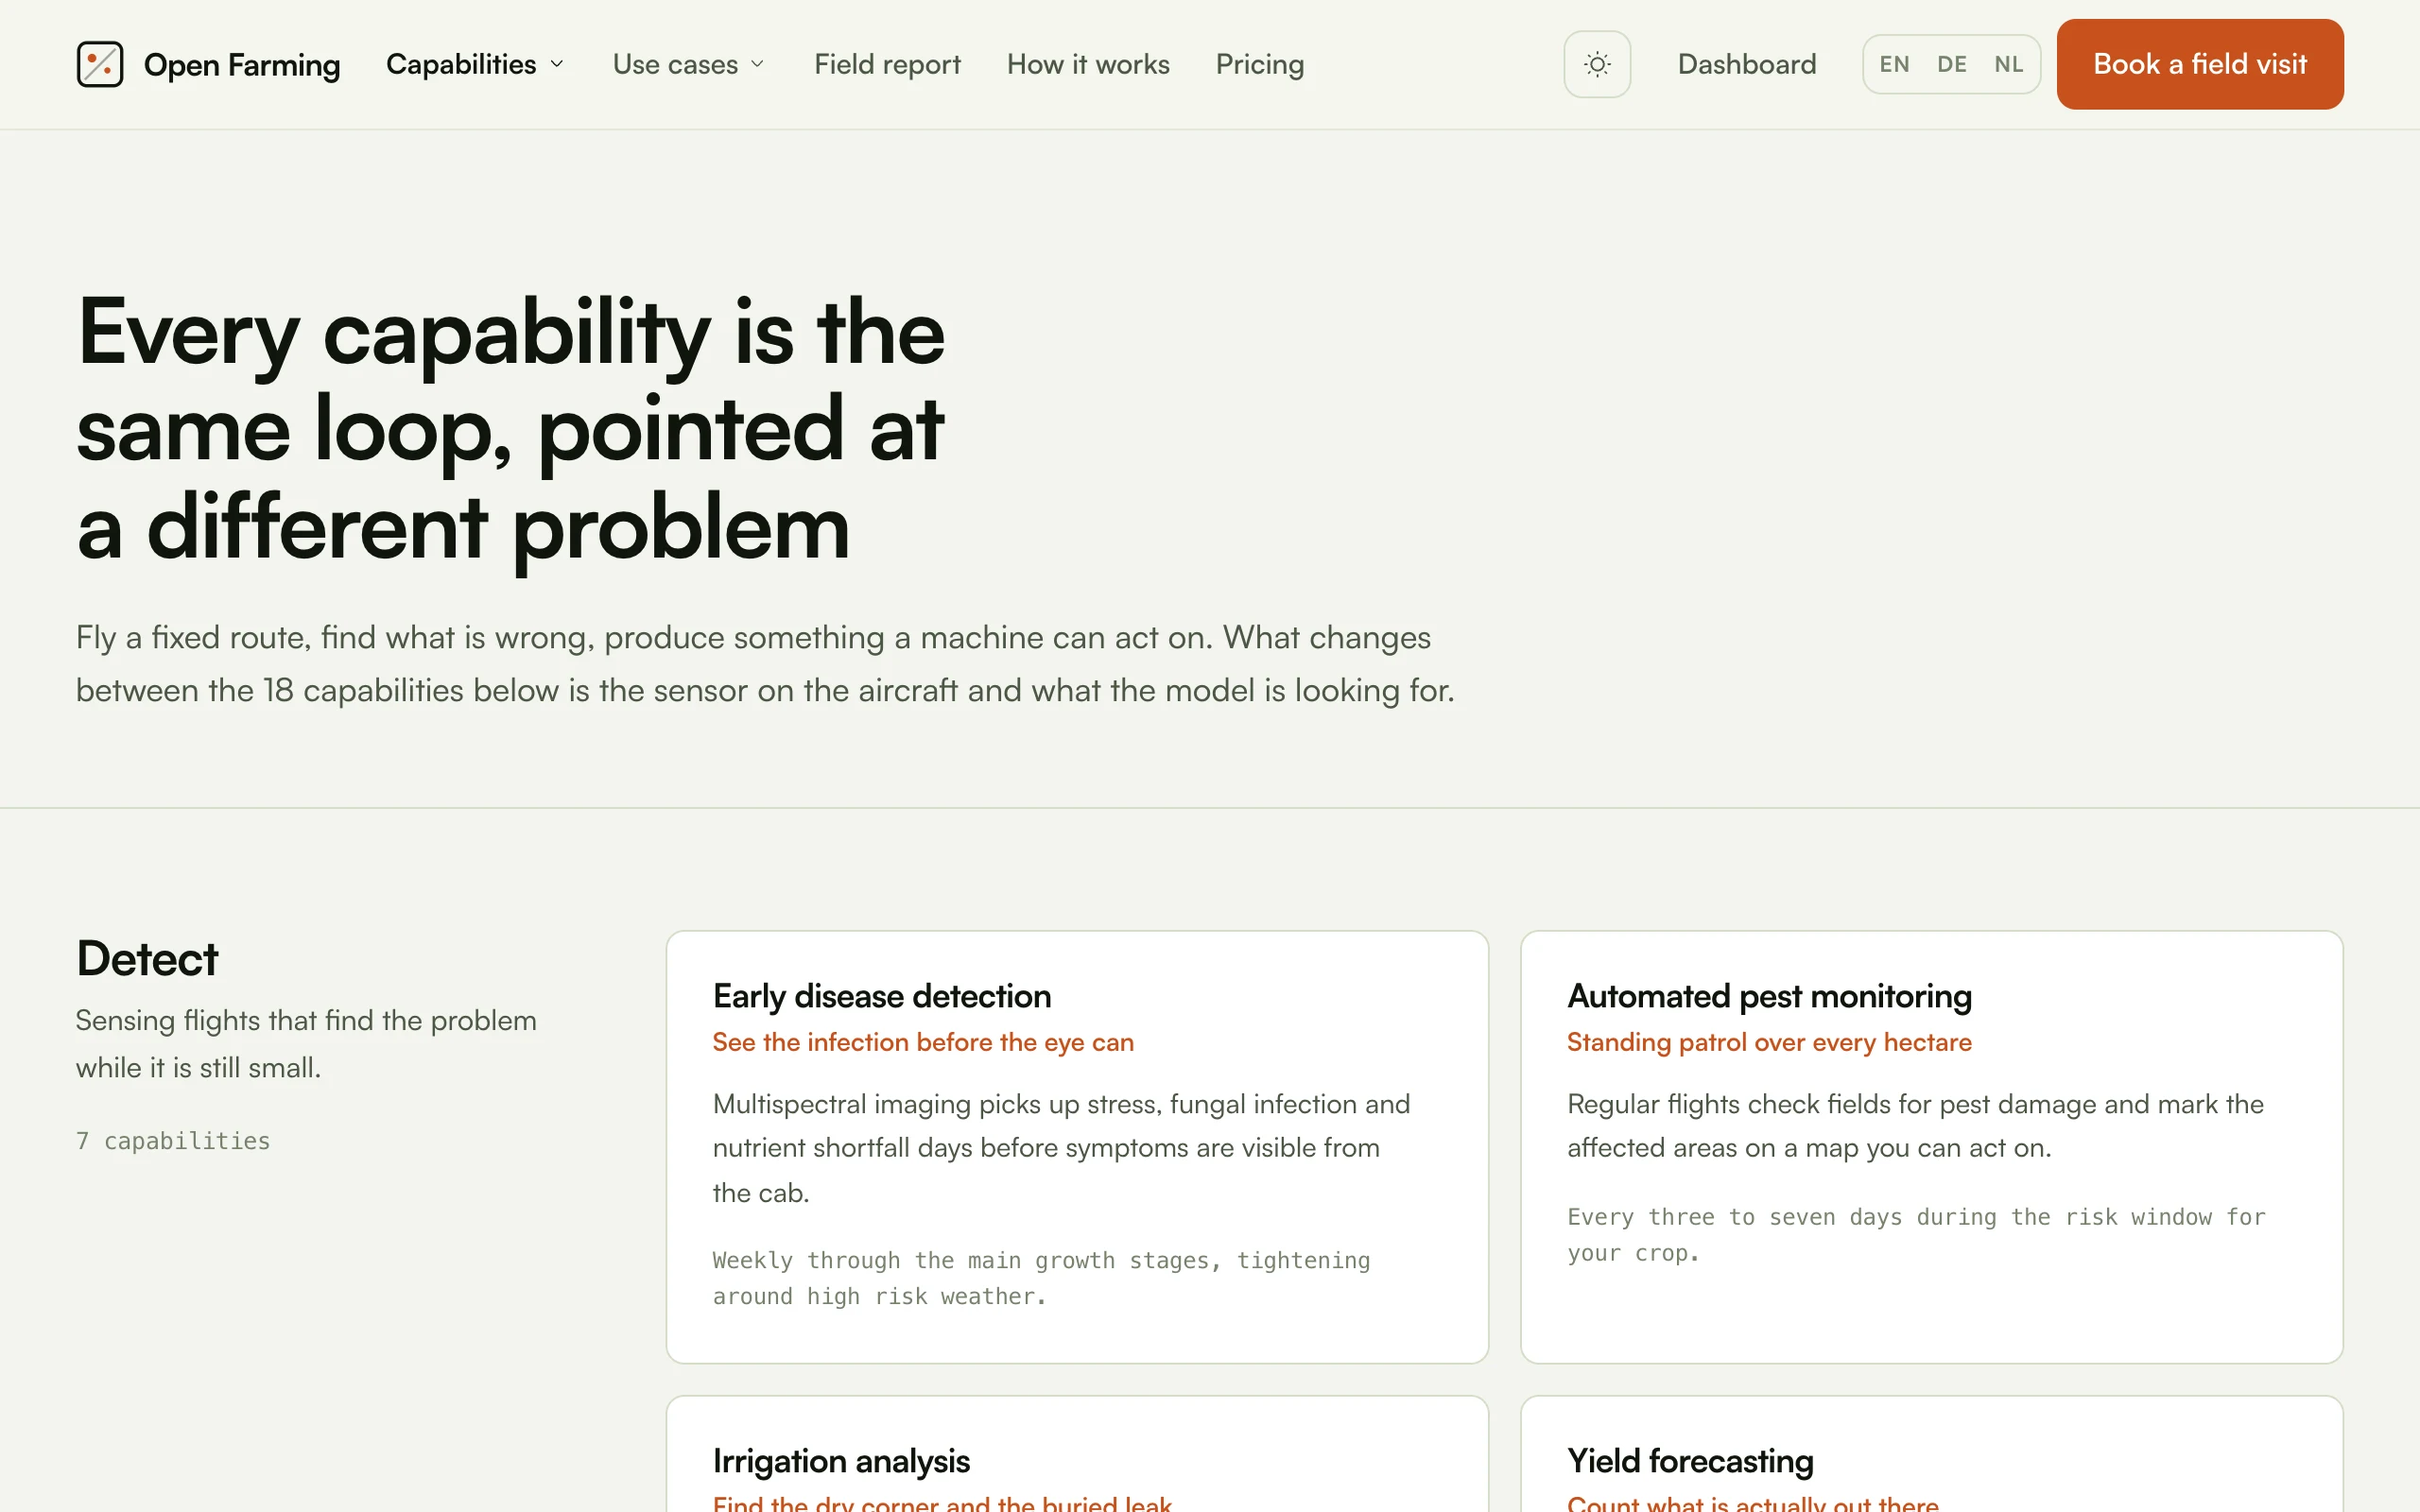
All 18 capabilities, grouped exactly as
featureCategories orders them: Detect, Act, Operate. Each card carries the
name, the tagline, the summary and the cadence, all read from
app/Support/content/features.ts through the shared catalog layer. Nothing on
this page is typed into a view.
One capability
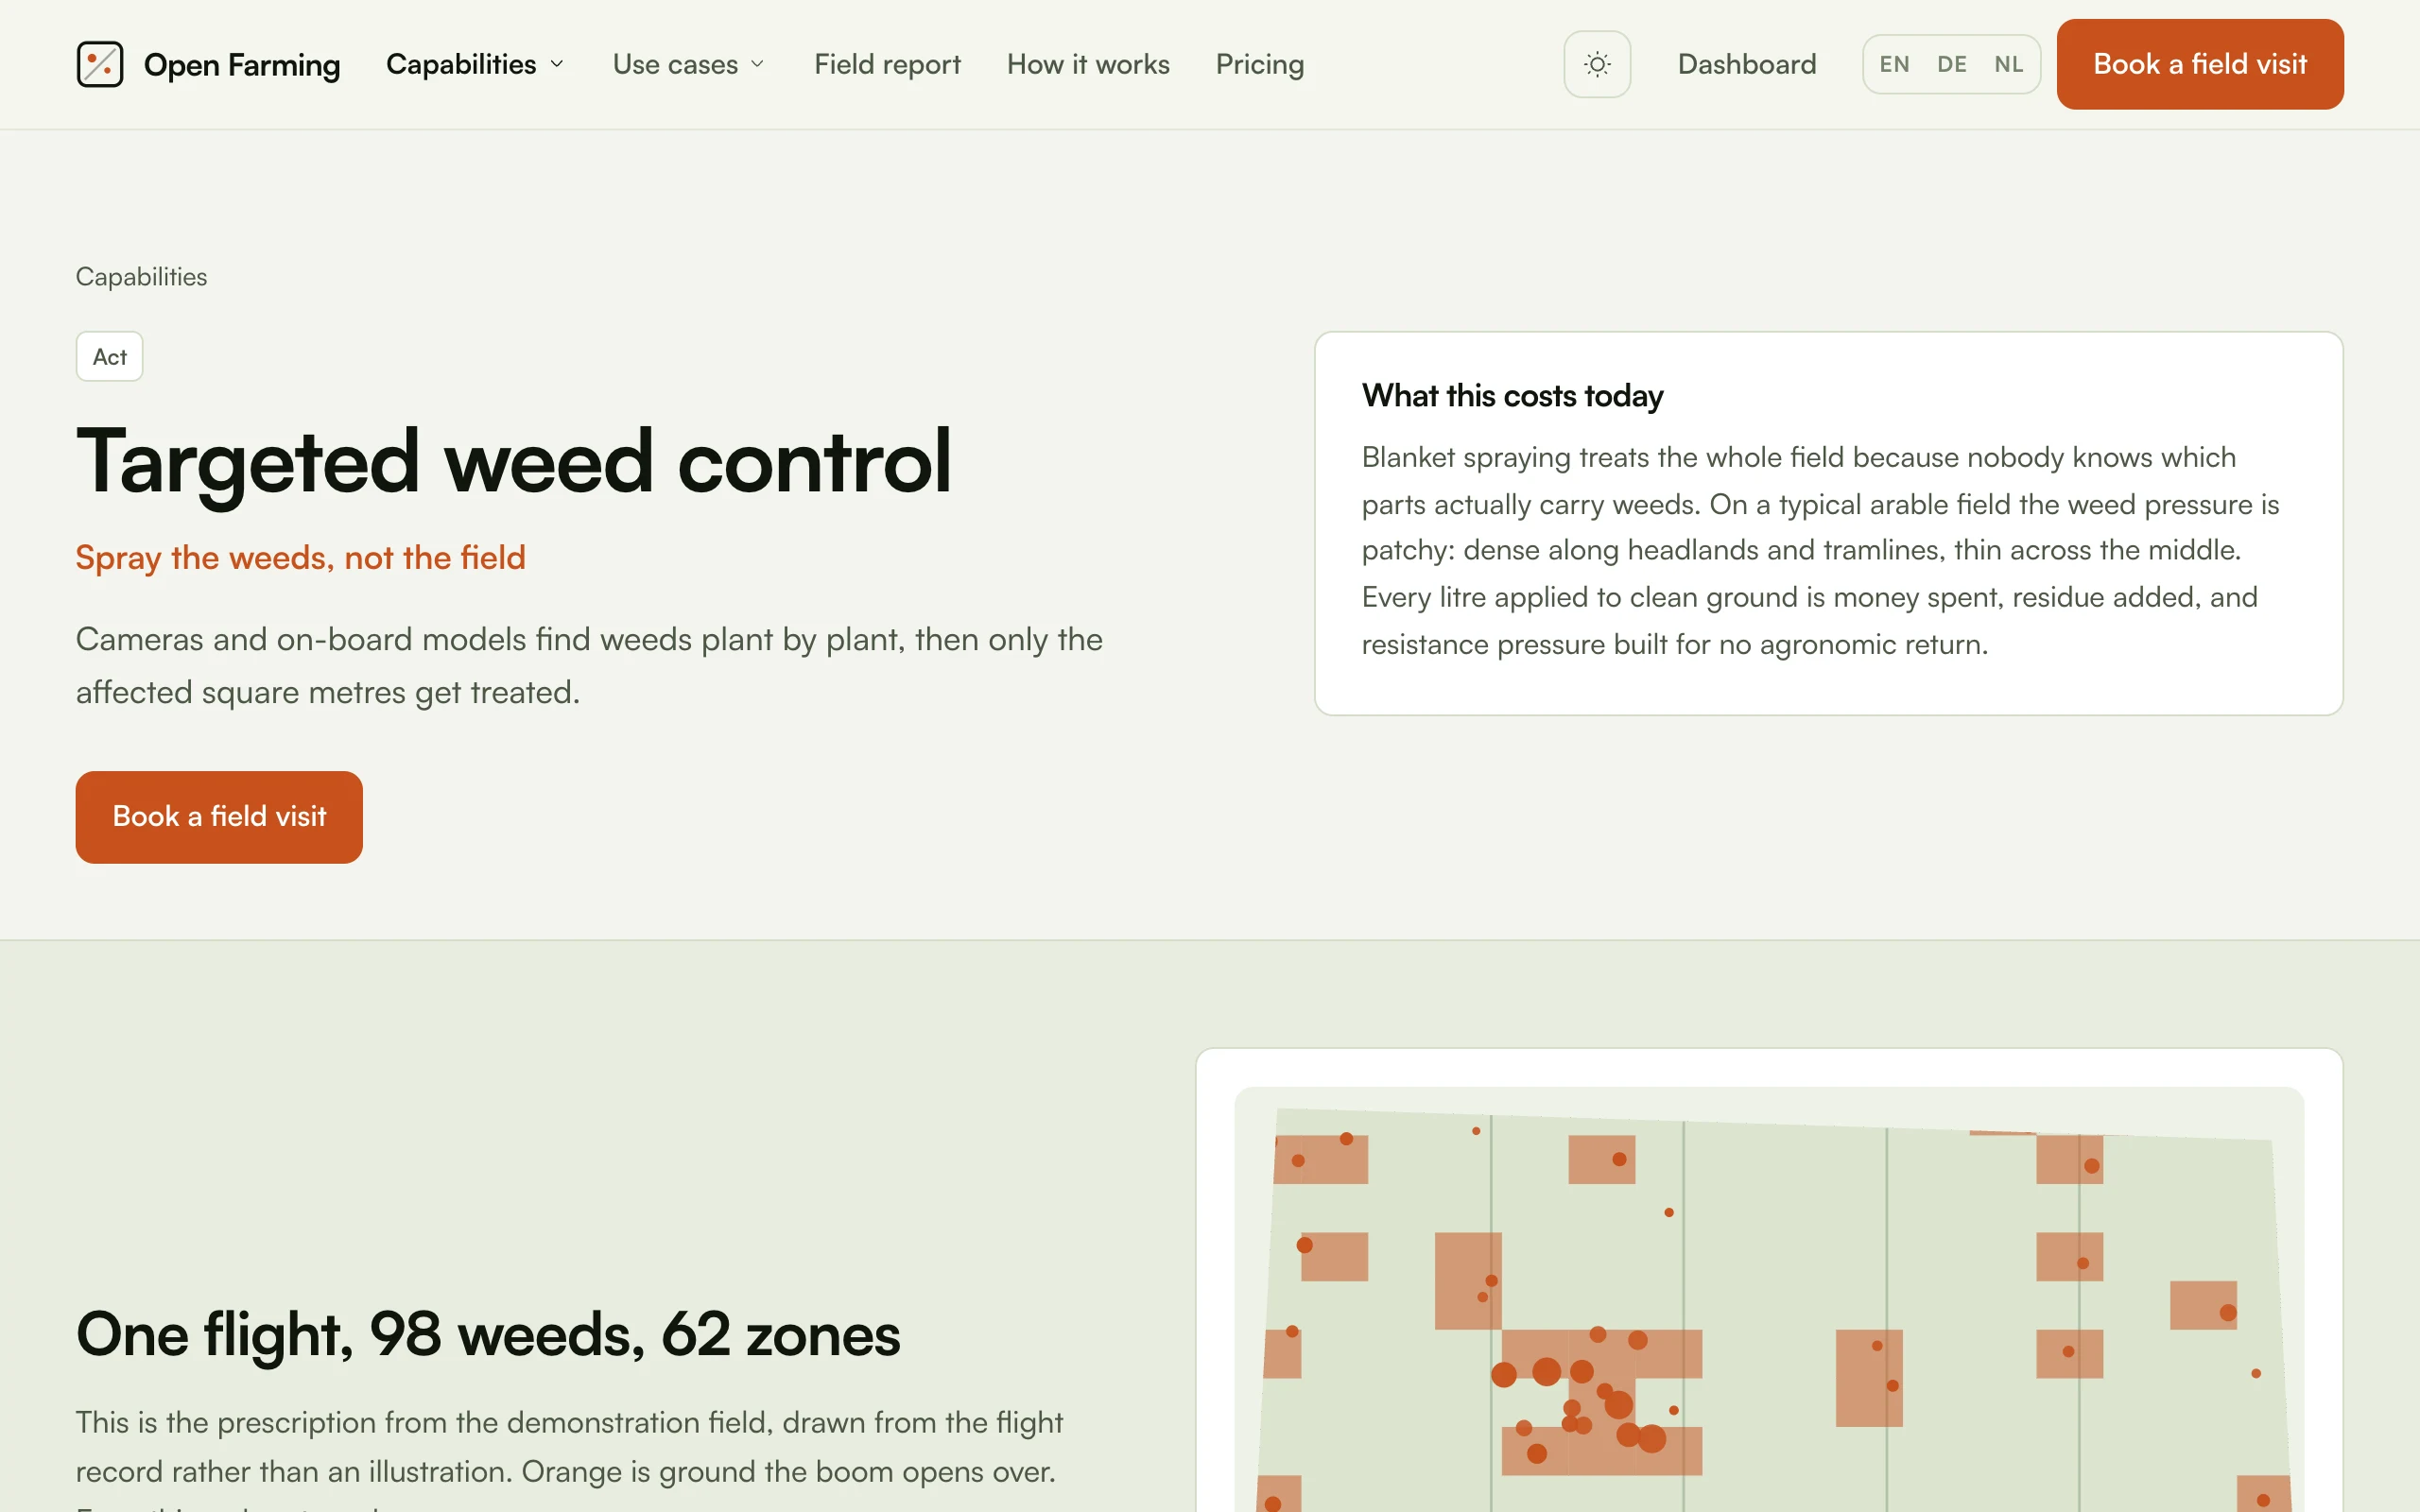
A capability page leads with what the problem costs today rather than with
the technology. The problem field in the content module is what fills that
panel, which is why the copy rules for it say two or three sentences,
concrete.
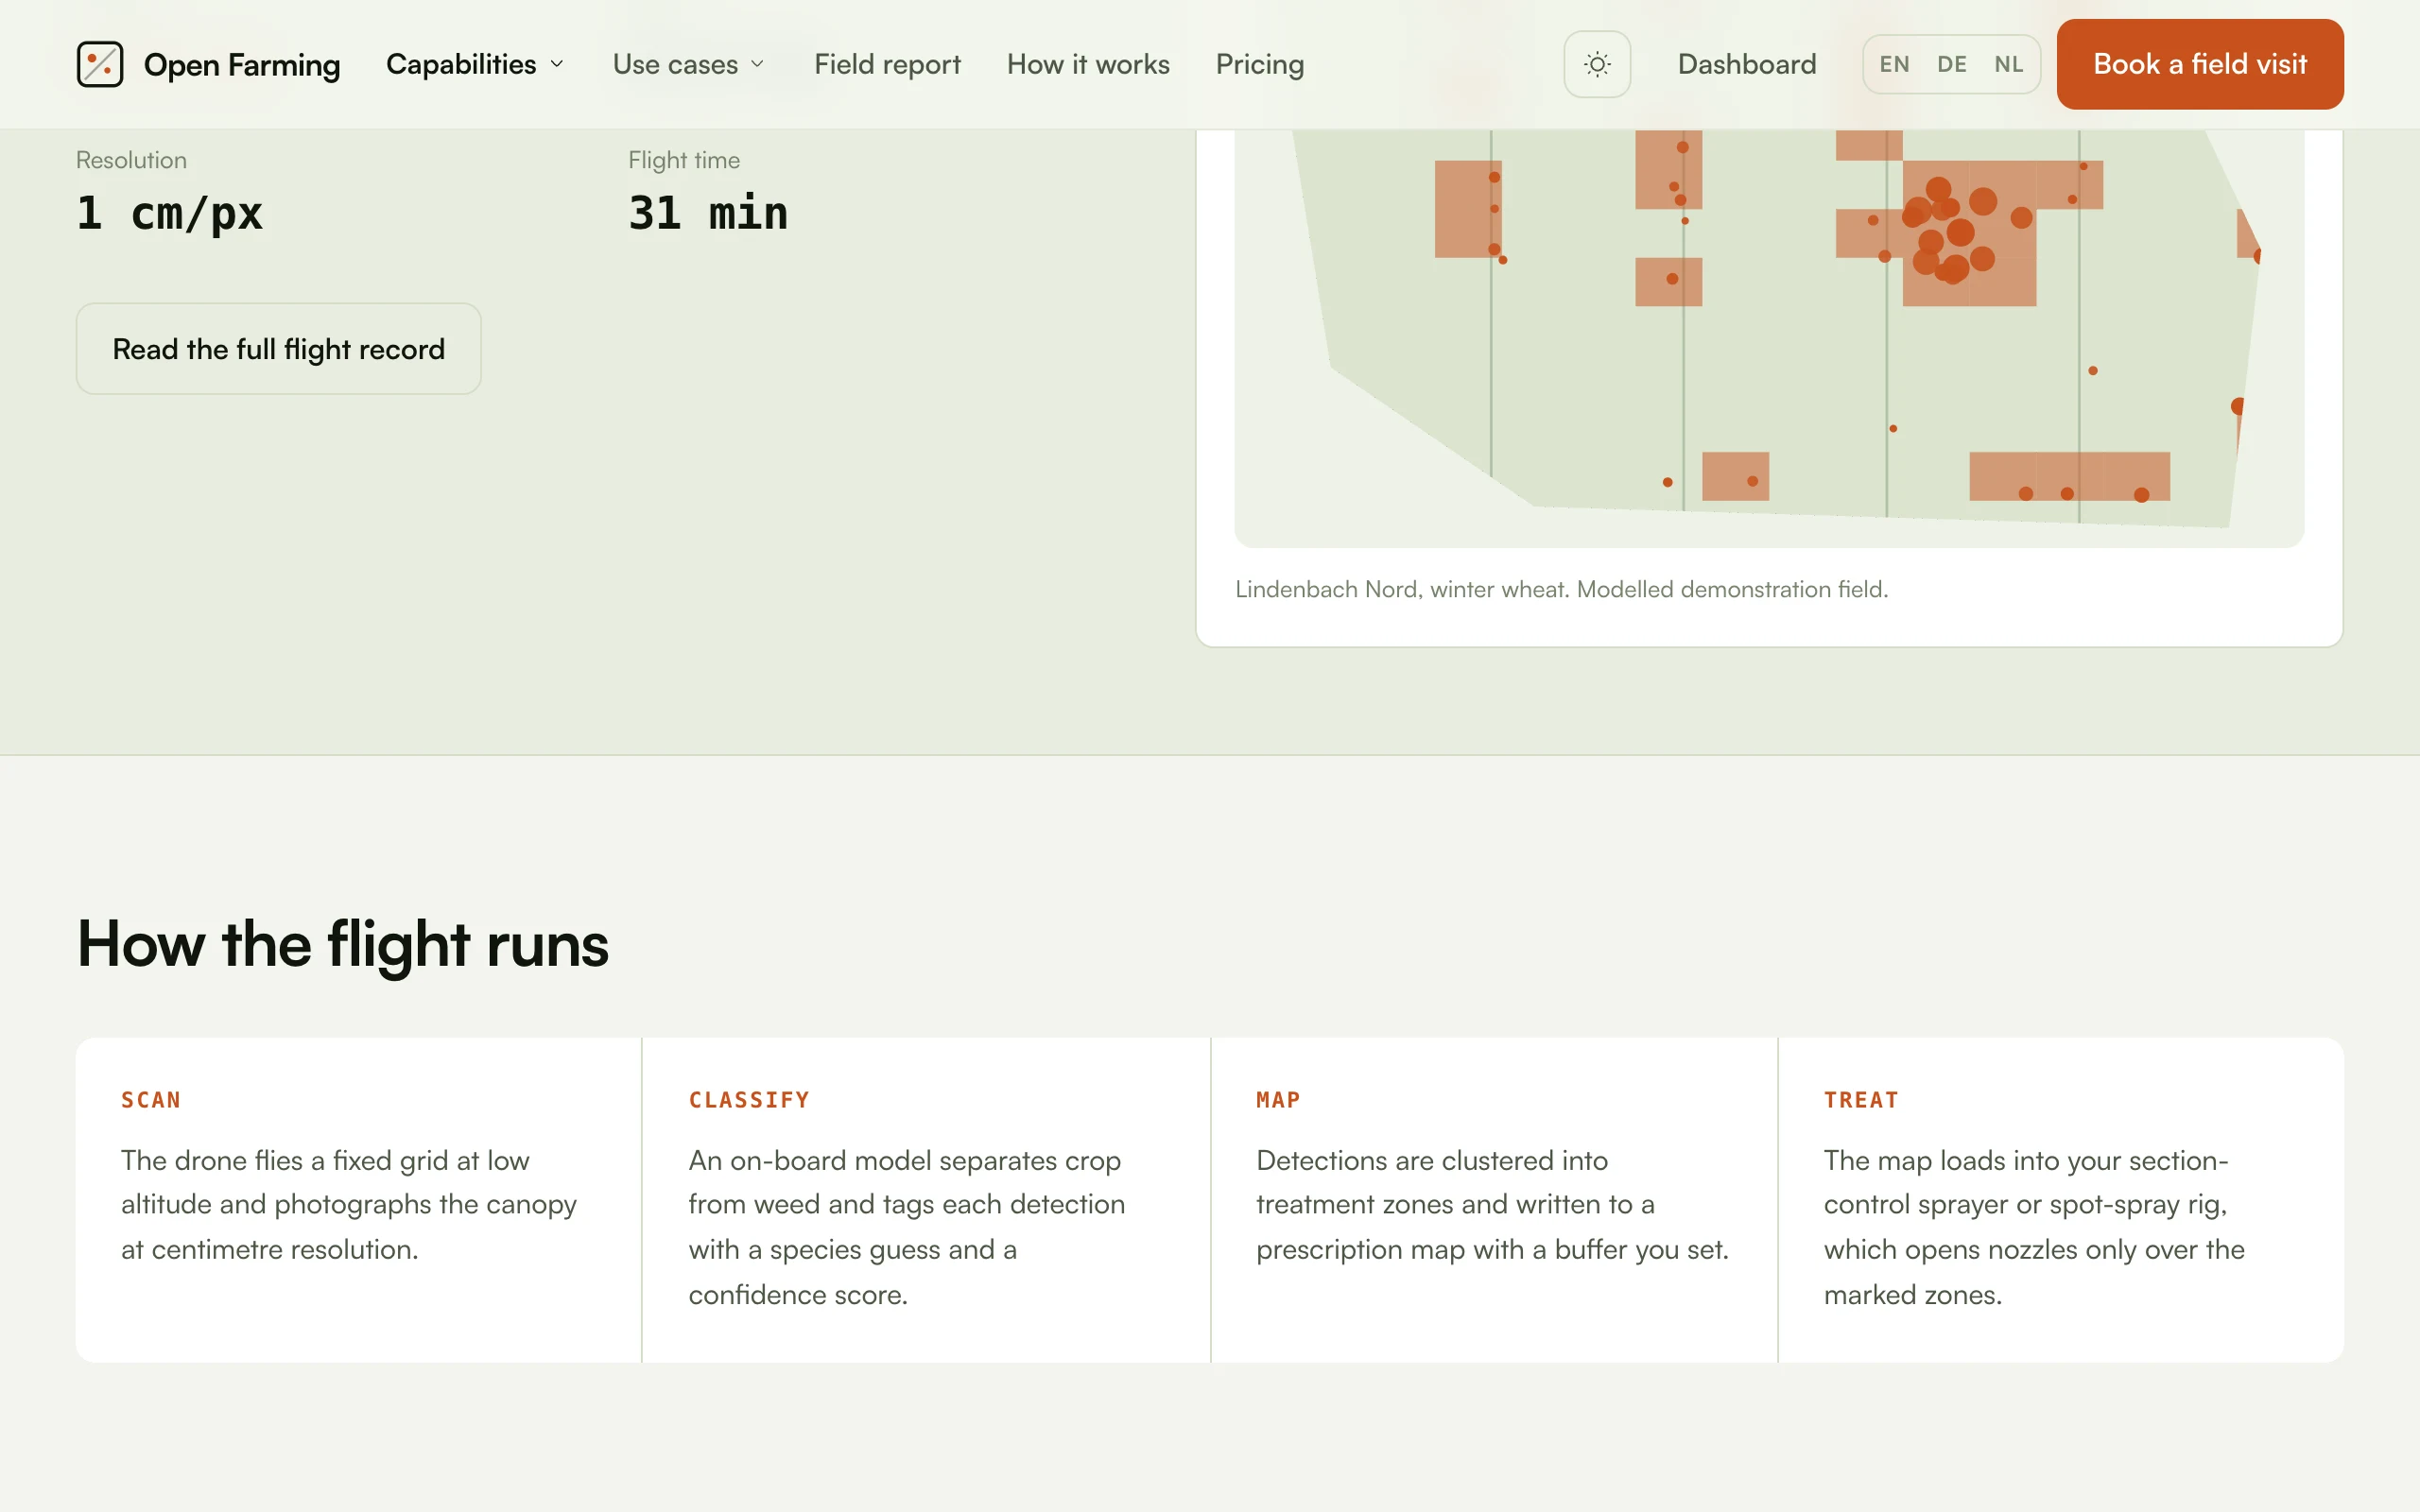
Below it, the steps[] array rendered in order. For
targeted weed control that is scan,
classify, map, treat, and the flight statistics above it (1 cm/px, 31 minutes)
come from the Mission row rather than from the copy.
Use cases
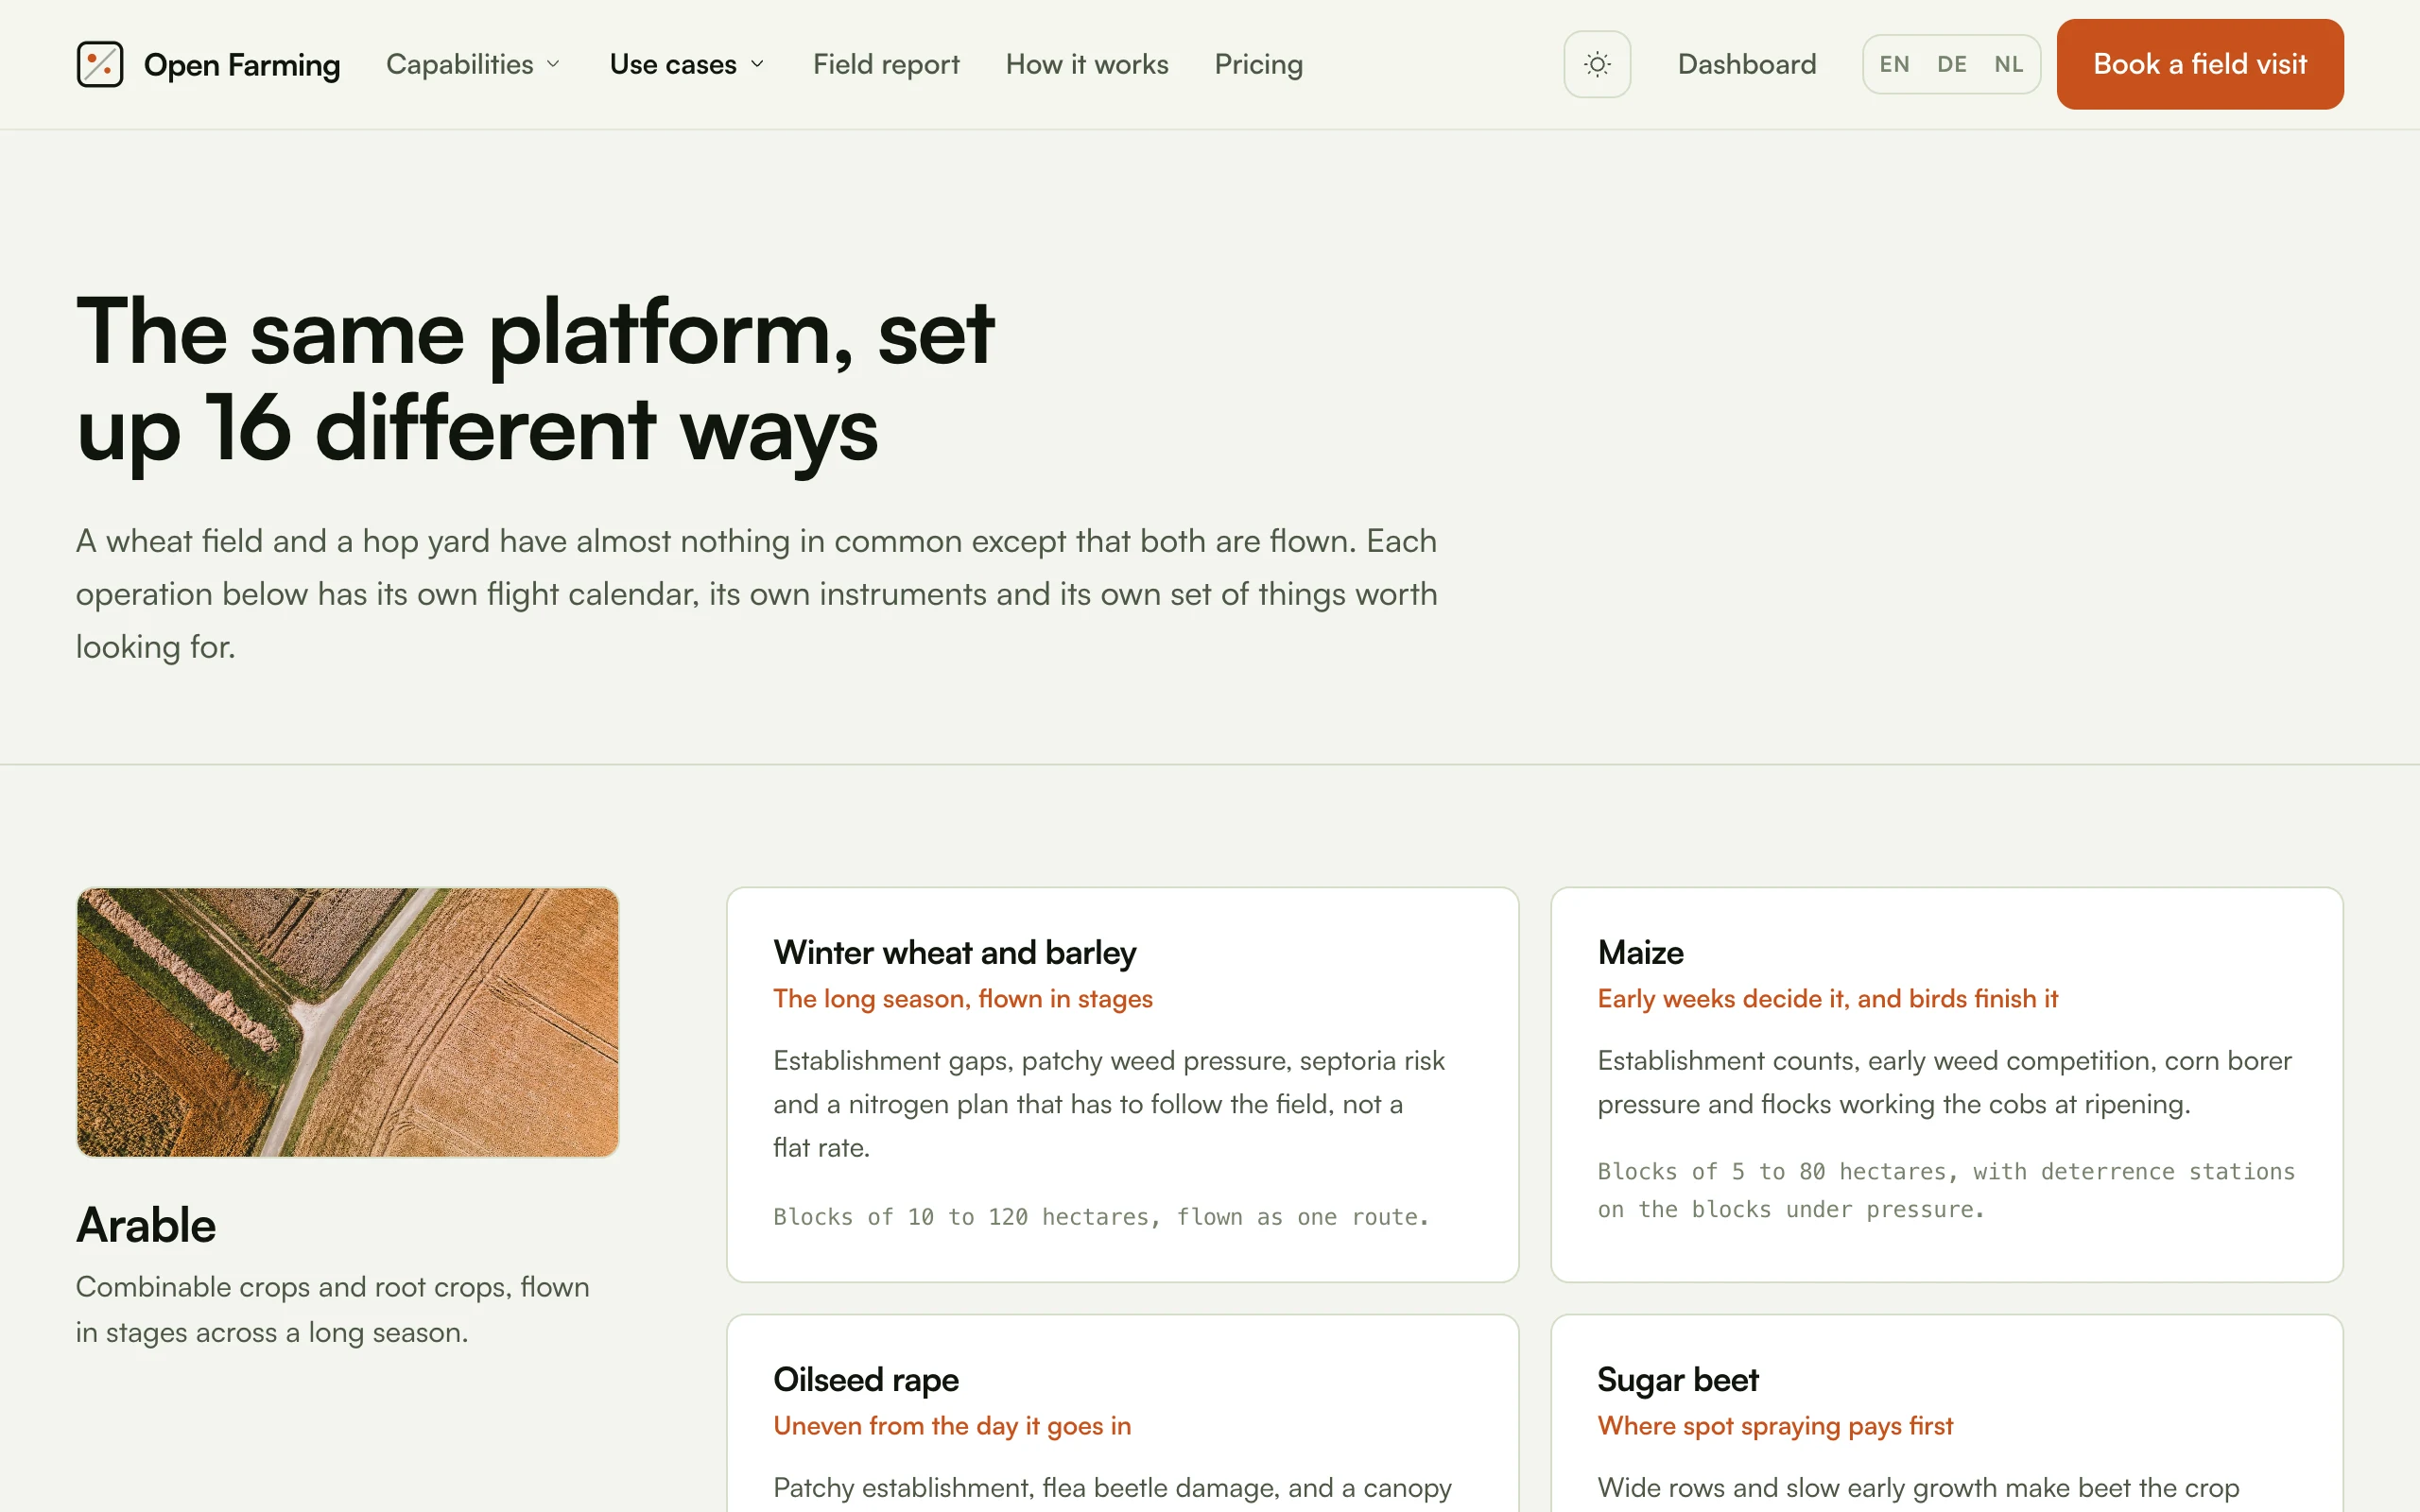
The same platform seen from sixteen different seats, grouped into the five segments. A wheat field and a hop yard have almost nothing in common except that both are flown, which is why a use case is a season and a set of problems rather than a feature list.
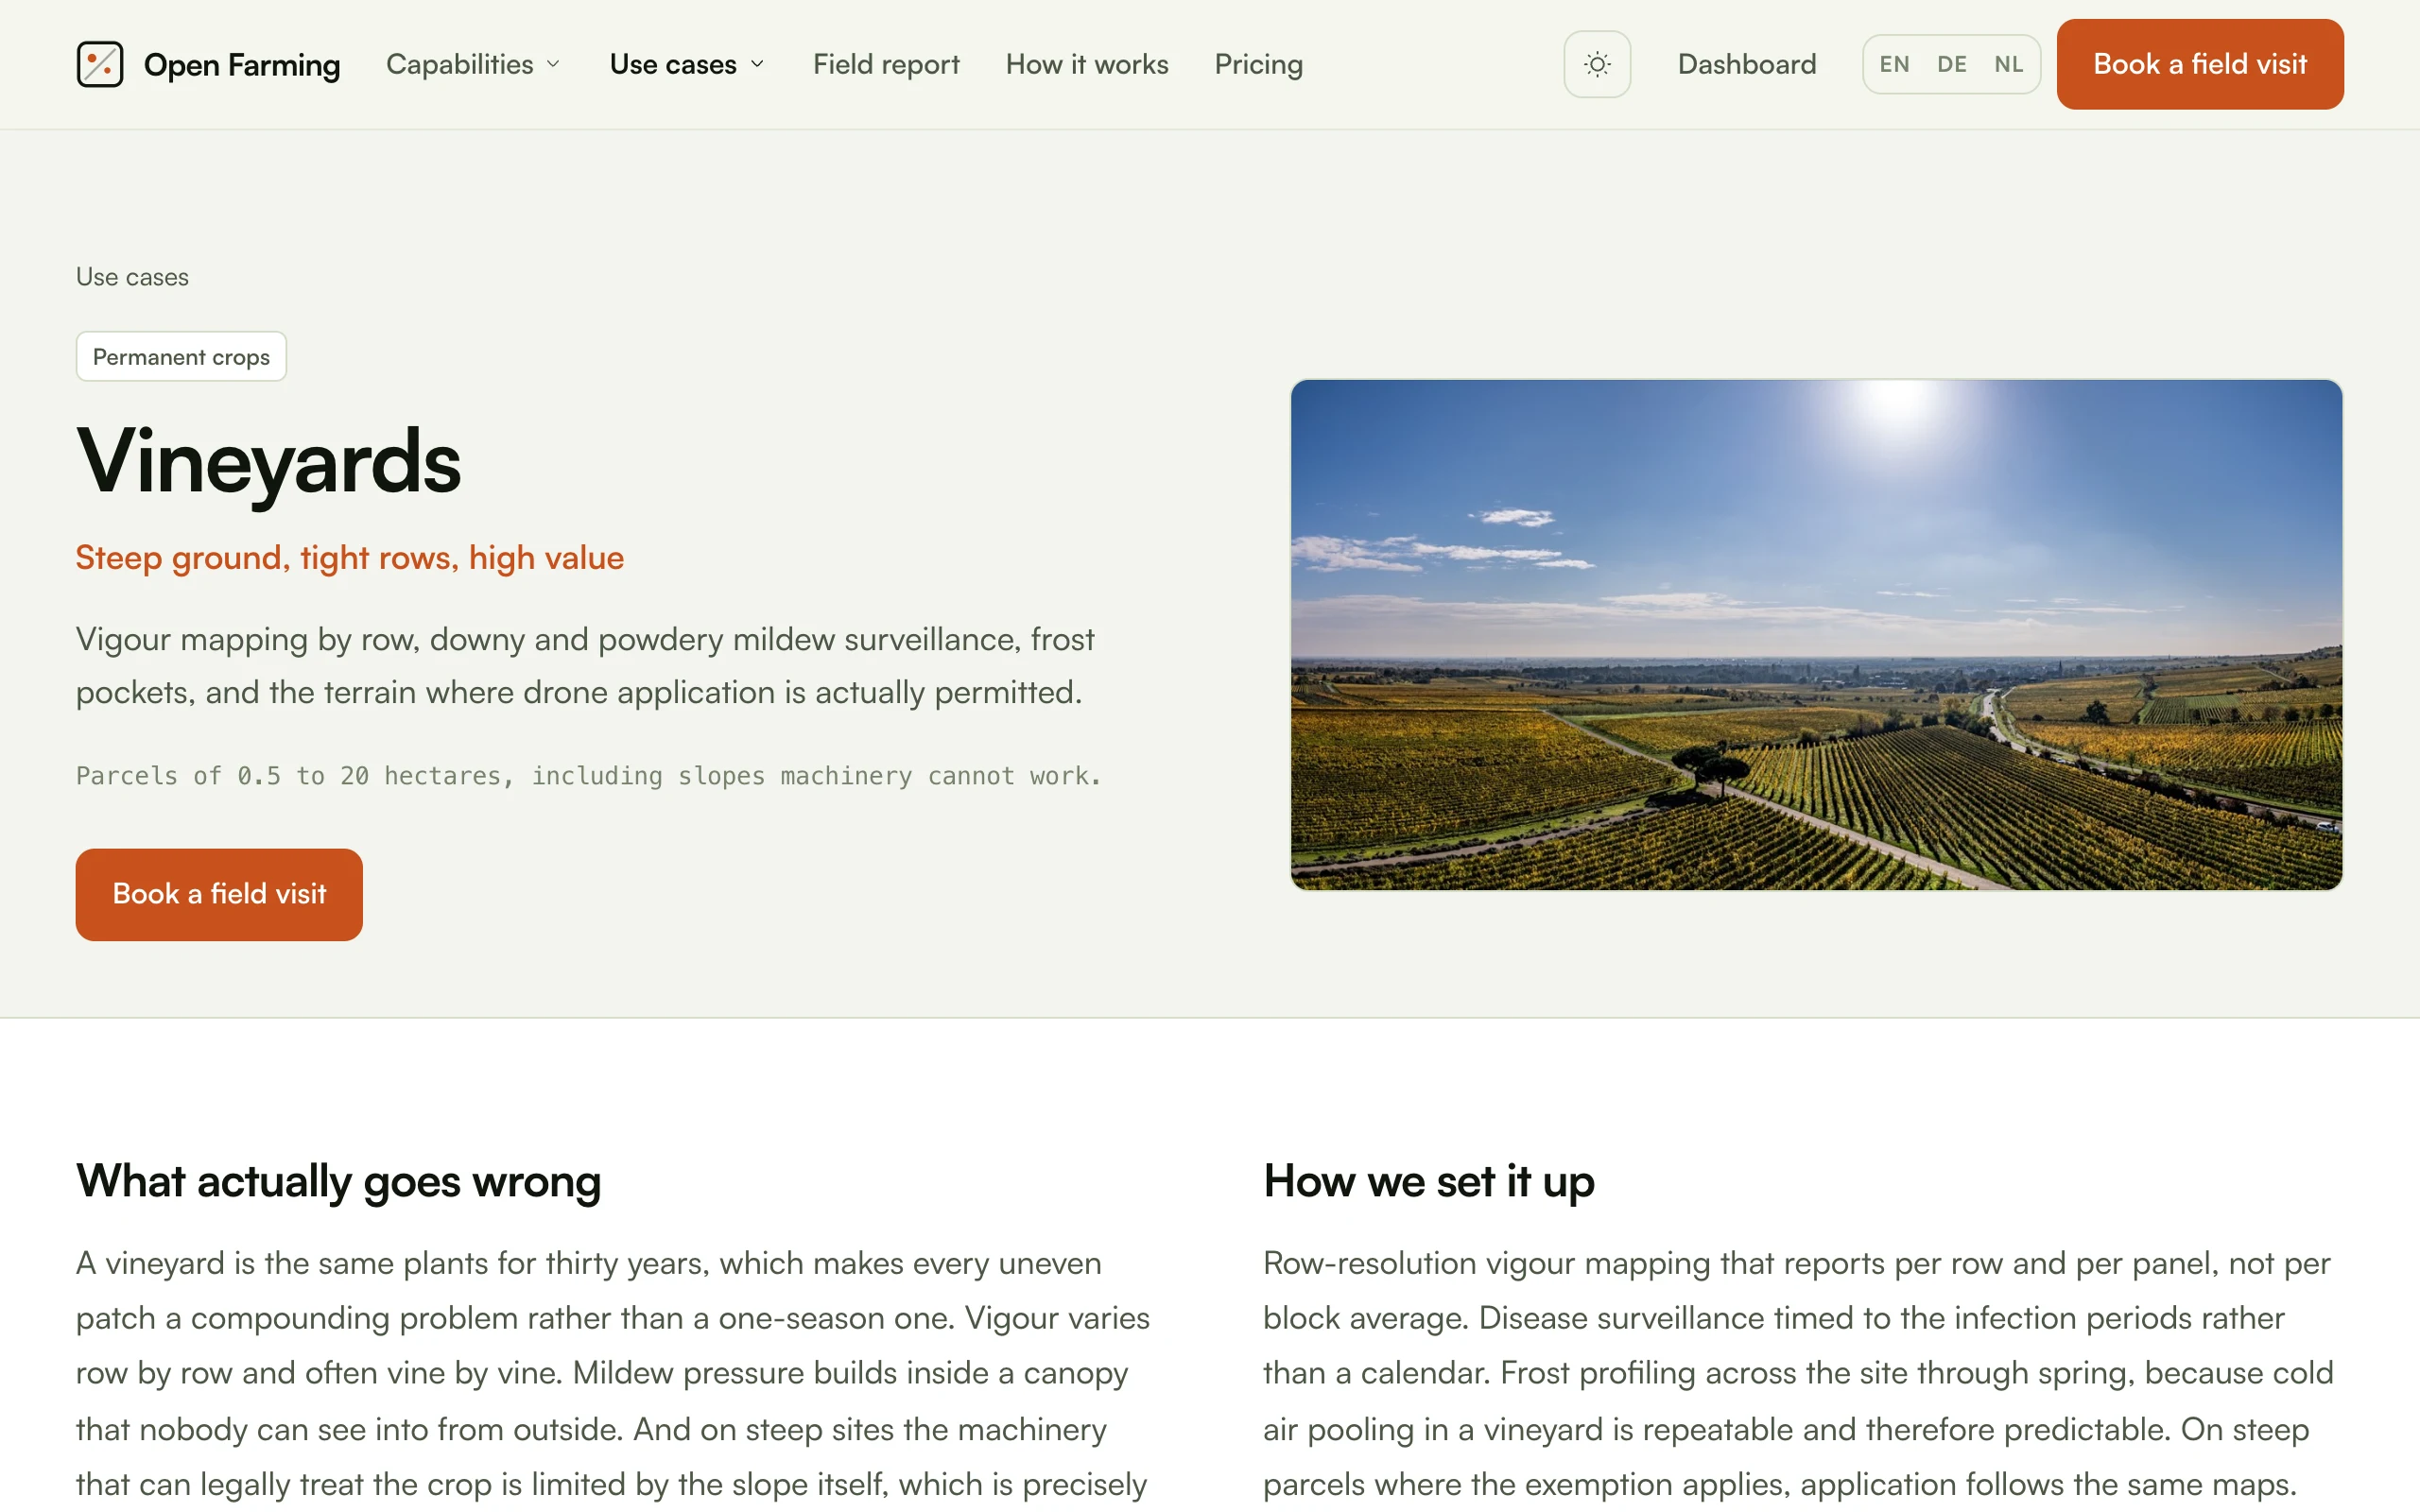
Each one answers the same two questions in the grower's own language.
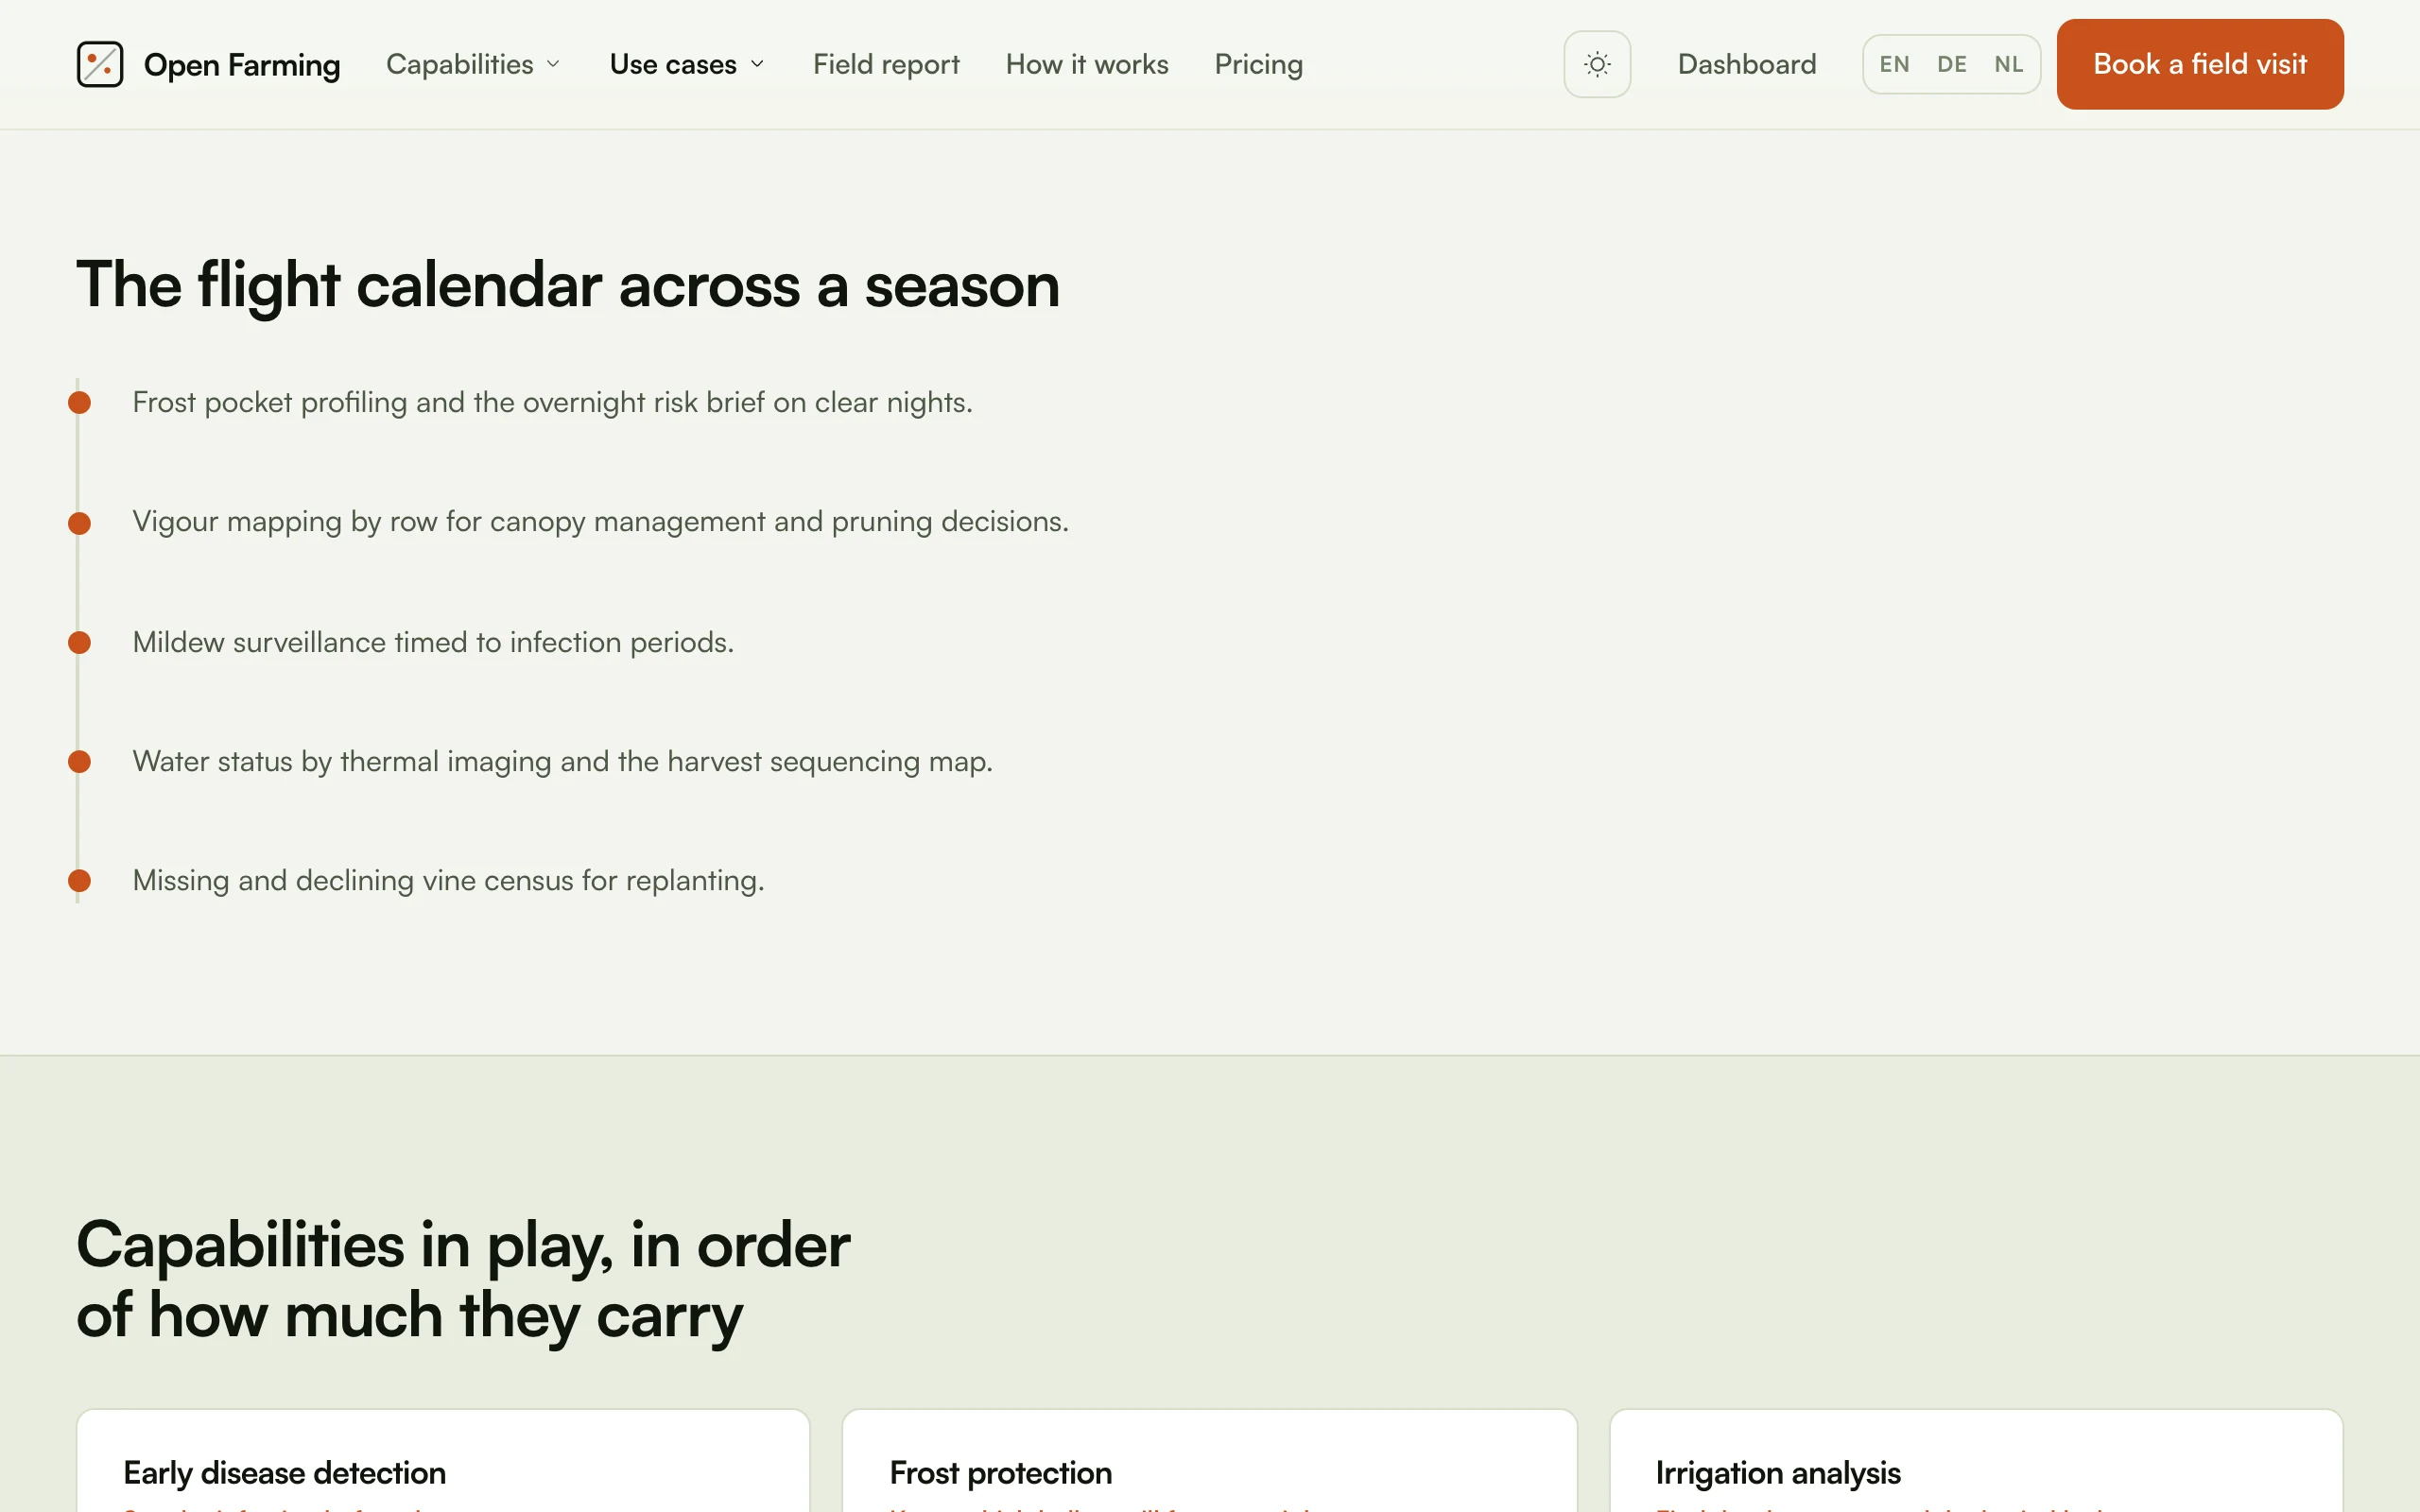
Then the season, window by window, and the capabilities in the order the
content module lists them: most load bearing first. That ordering is preserved
all the way out to /api/use-cases/{slug}.
How it works
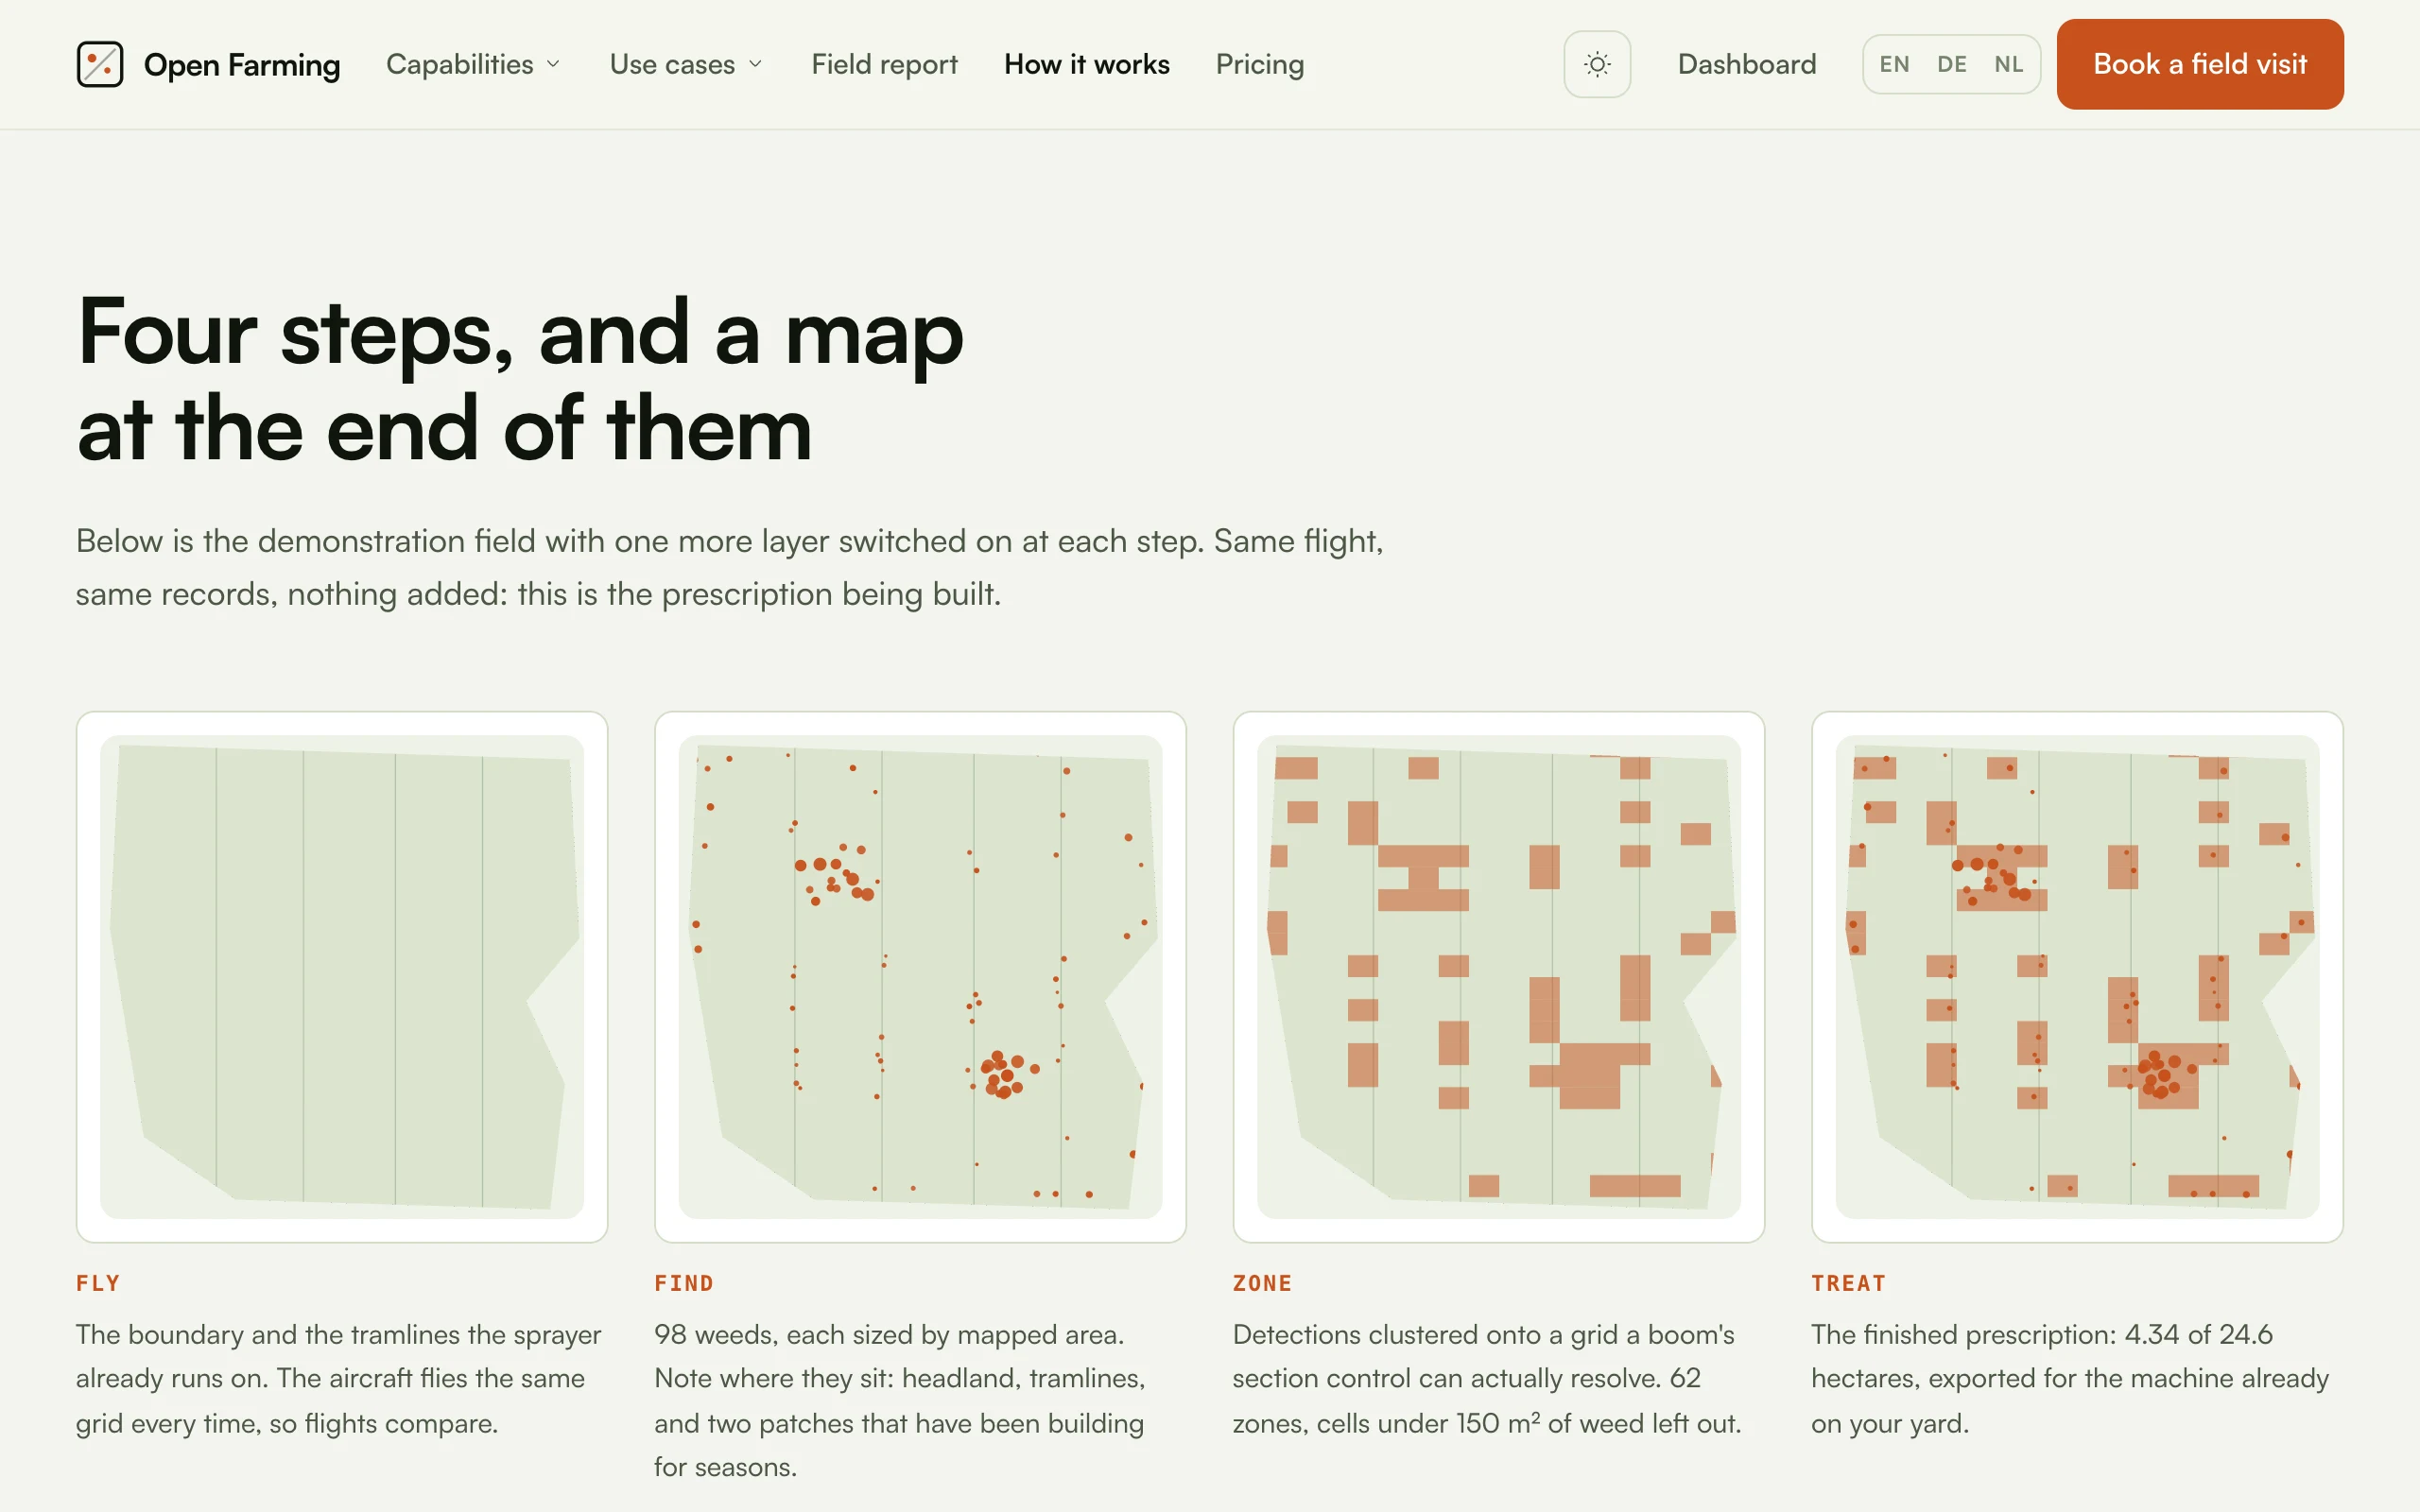
The best page on the site, and the one worth copying if you build something similar. It is the same flight record drawn four times with one more layer switched on each time: the boundary and tramlines, then the 98 detections sized by mapped area, then the clustering onto a grid a boom can resolve, then the finished prescription. Nothing is added between frames, which is the point it is making. See Prescriptions for the production version of that clustering step.
Pricing
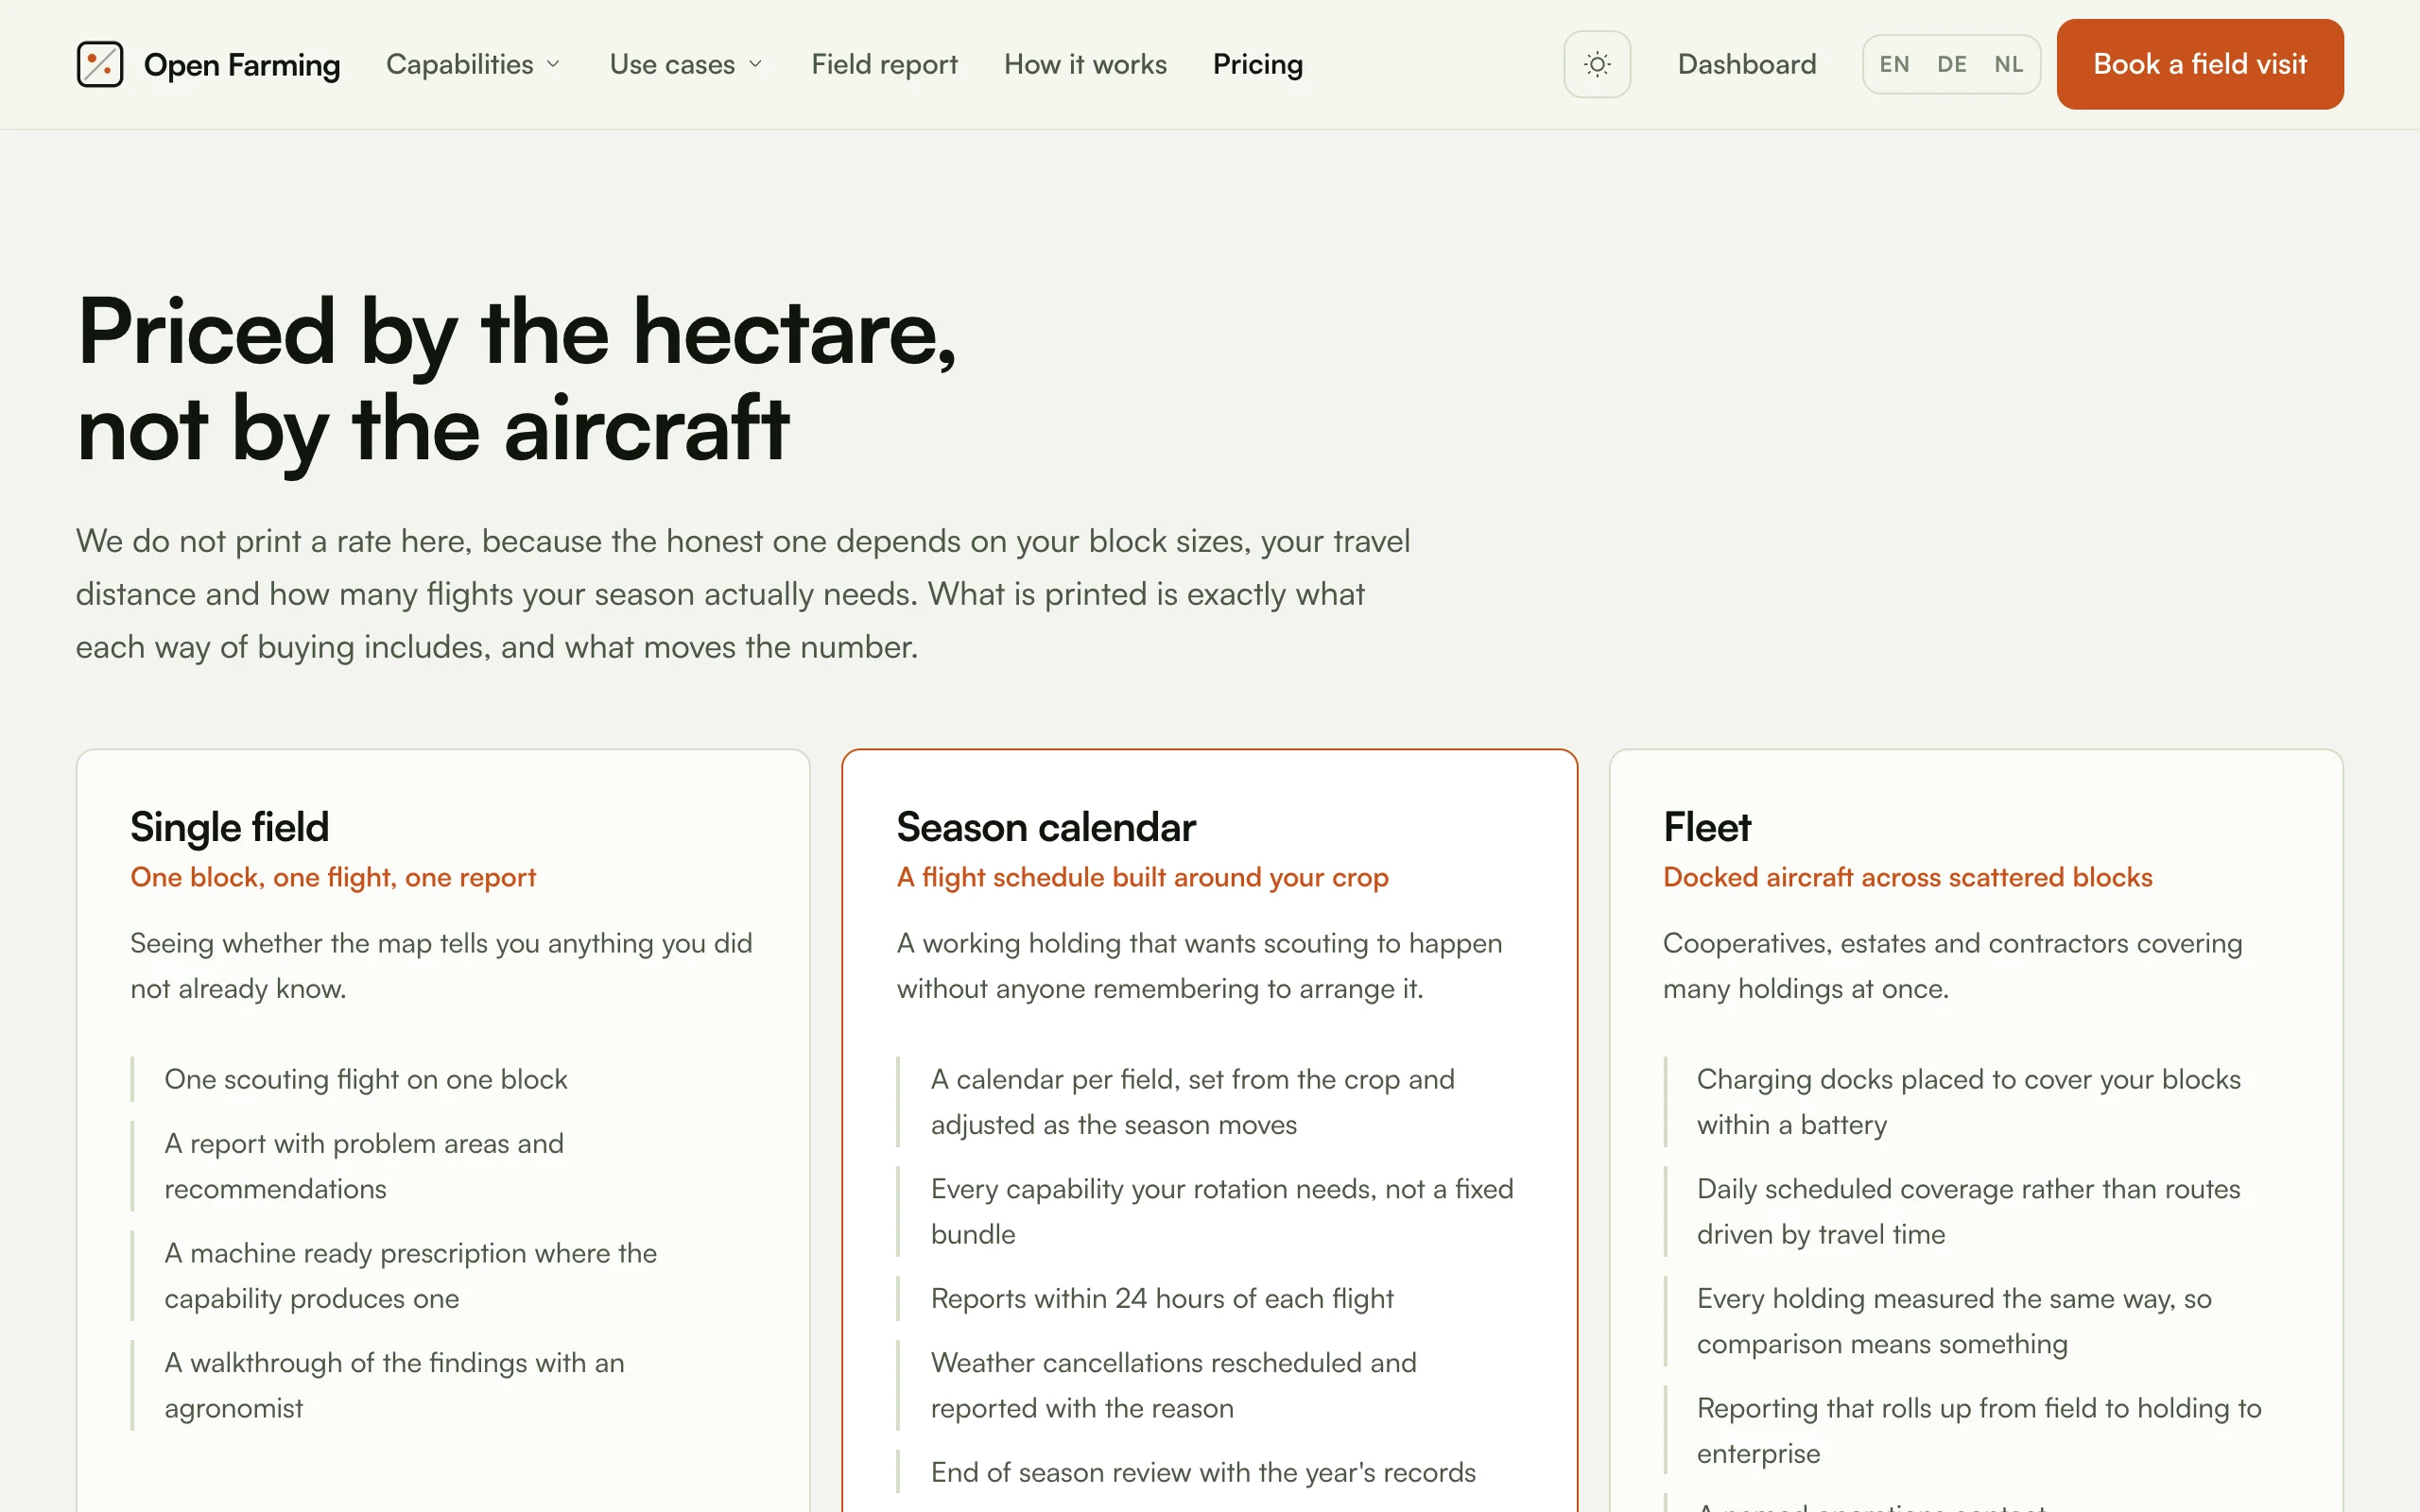
No rate is printed, and the page says why: the honest number depends on block sizes, travel distance and how many flights the season actually needs. What is printed is what each way of buying includes. The economics behind that position are in Costs.
Booking a visit
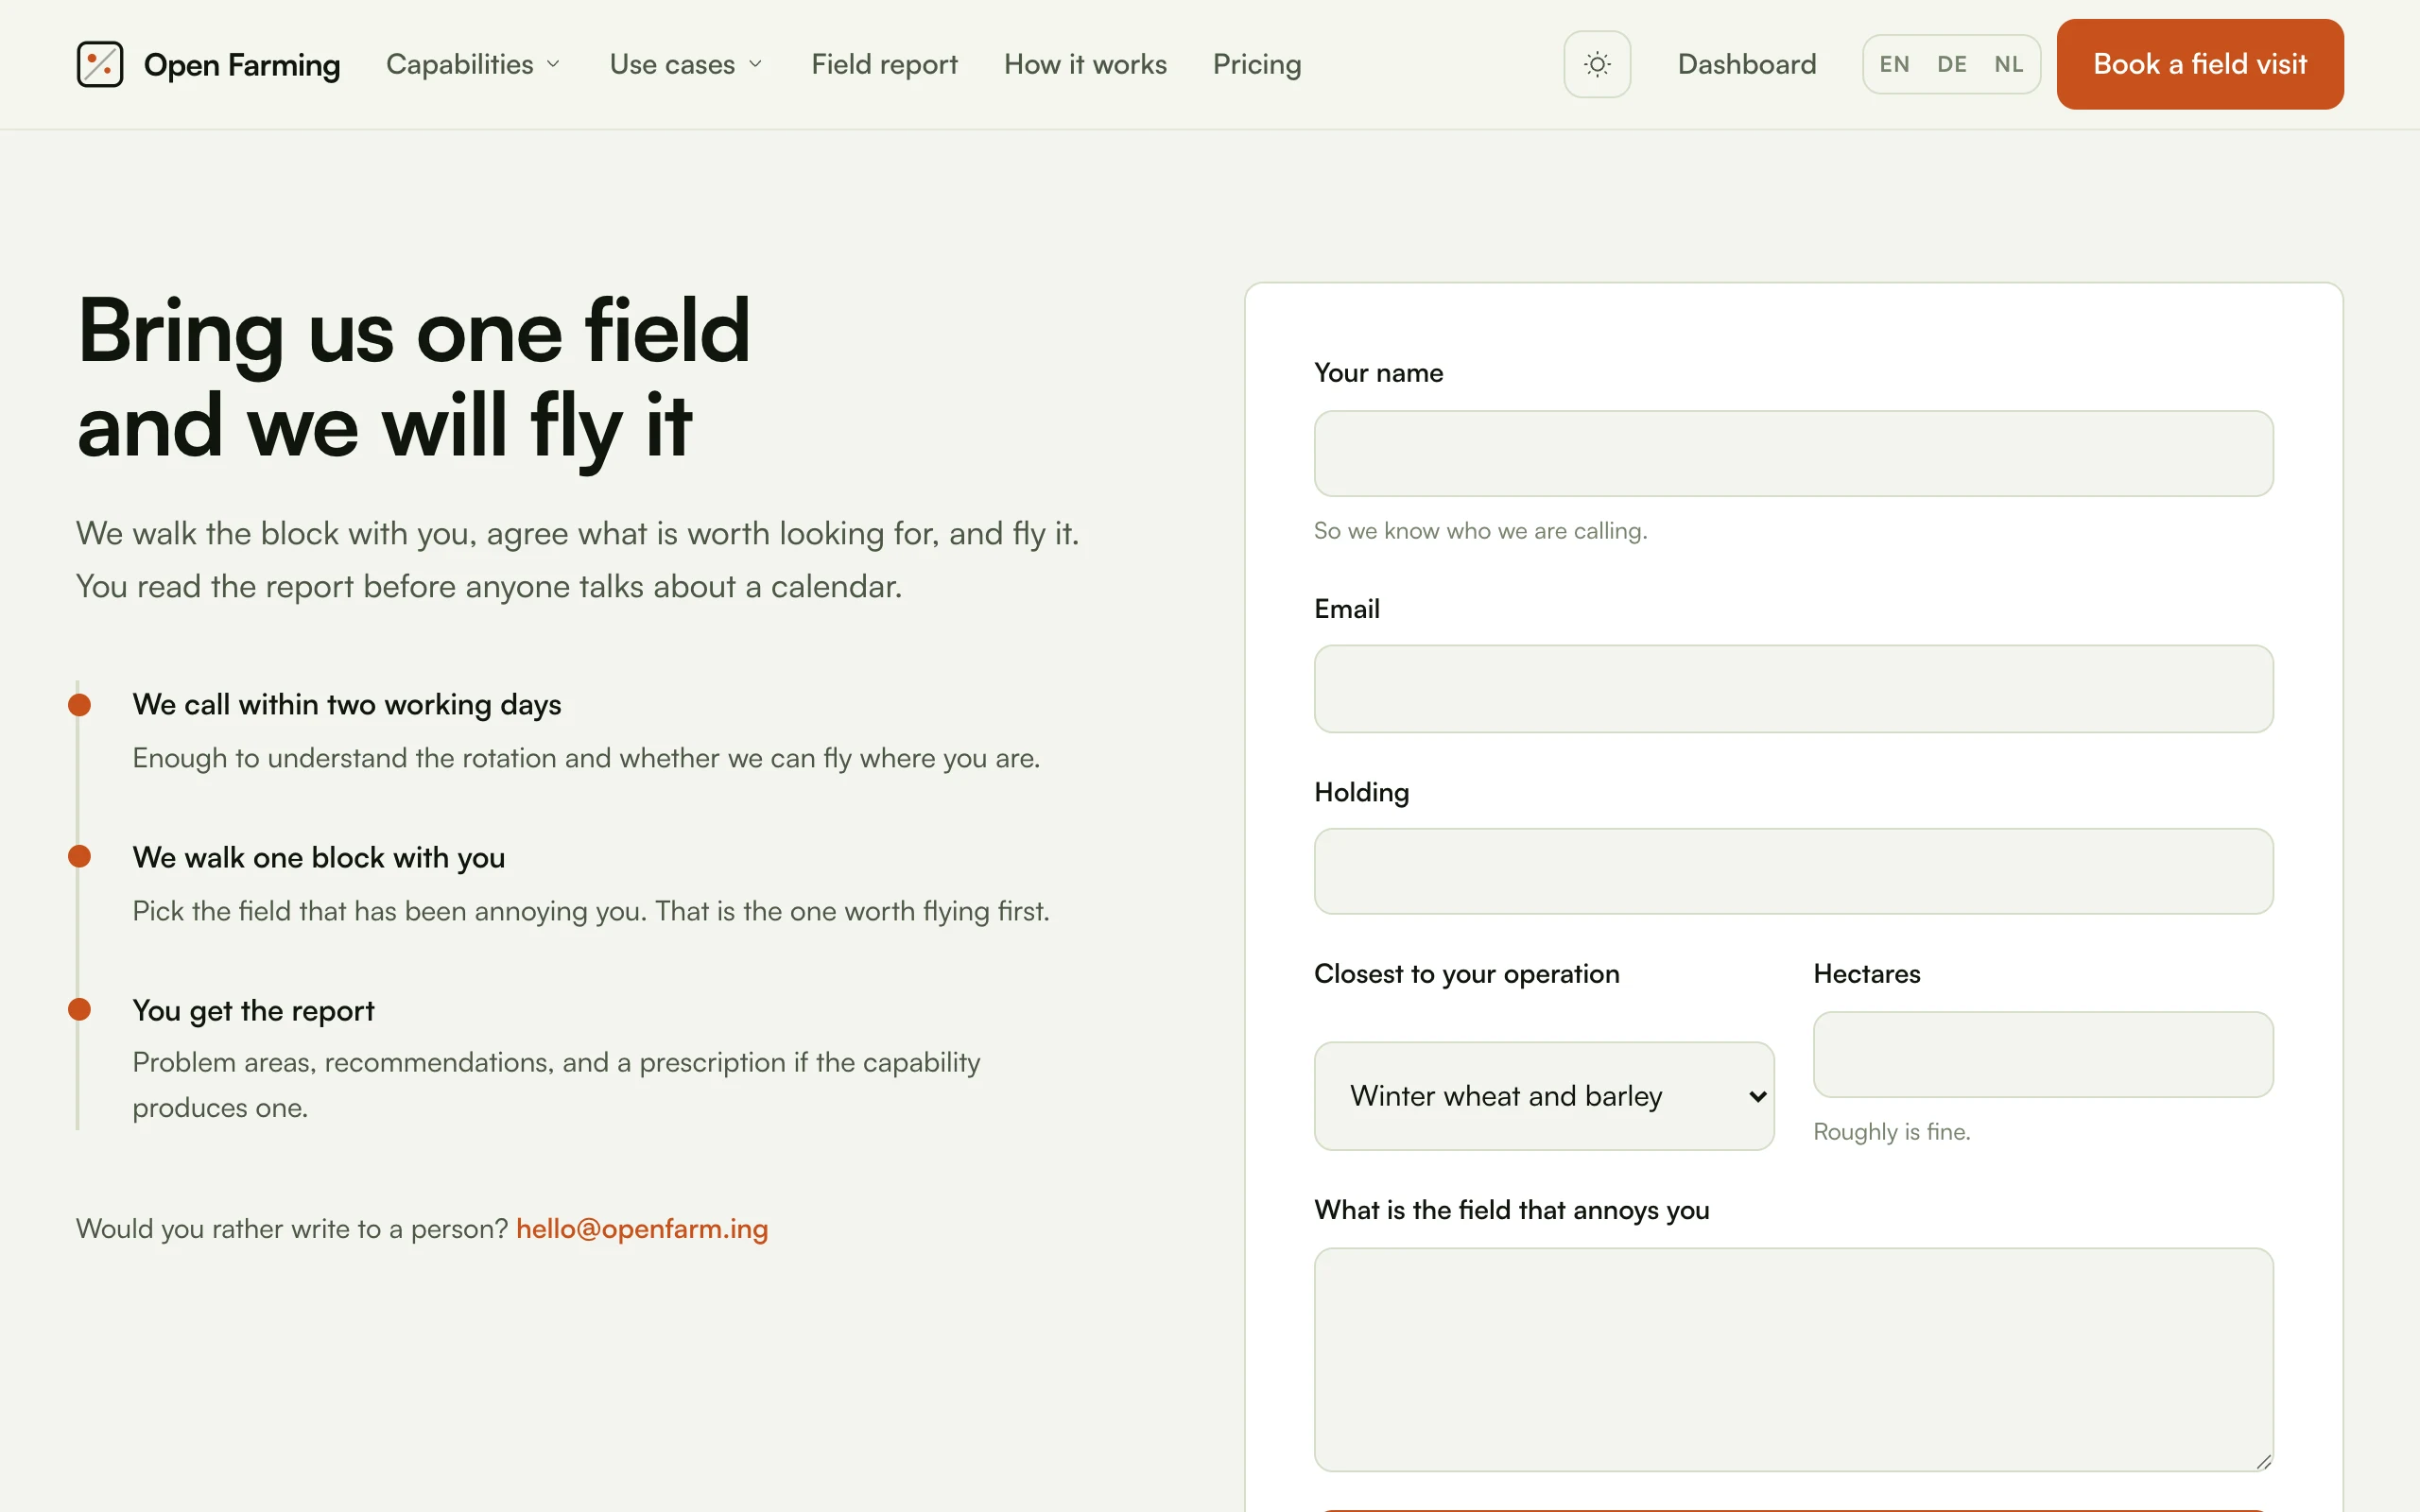
The only write the public internet can make. The form is plain server-rendered
HTML with no client bundle, which is the point on a phone in a farmyard, and
its fields map one to one onto the
POST /api/demo-requests contract: name,
email, holding, segment, hectares, message.
The field report
The worked example, published in full at /field-report.
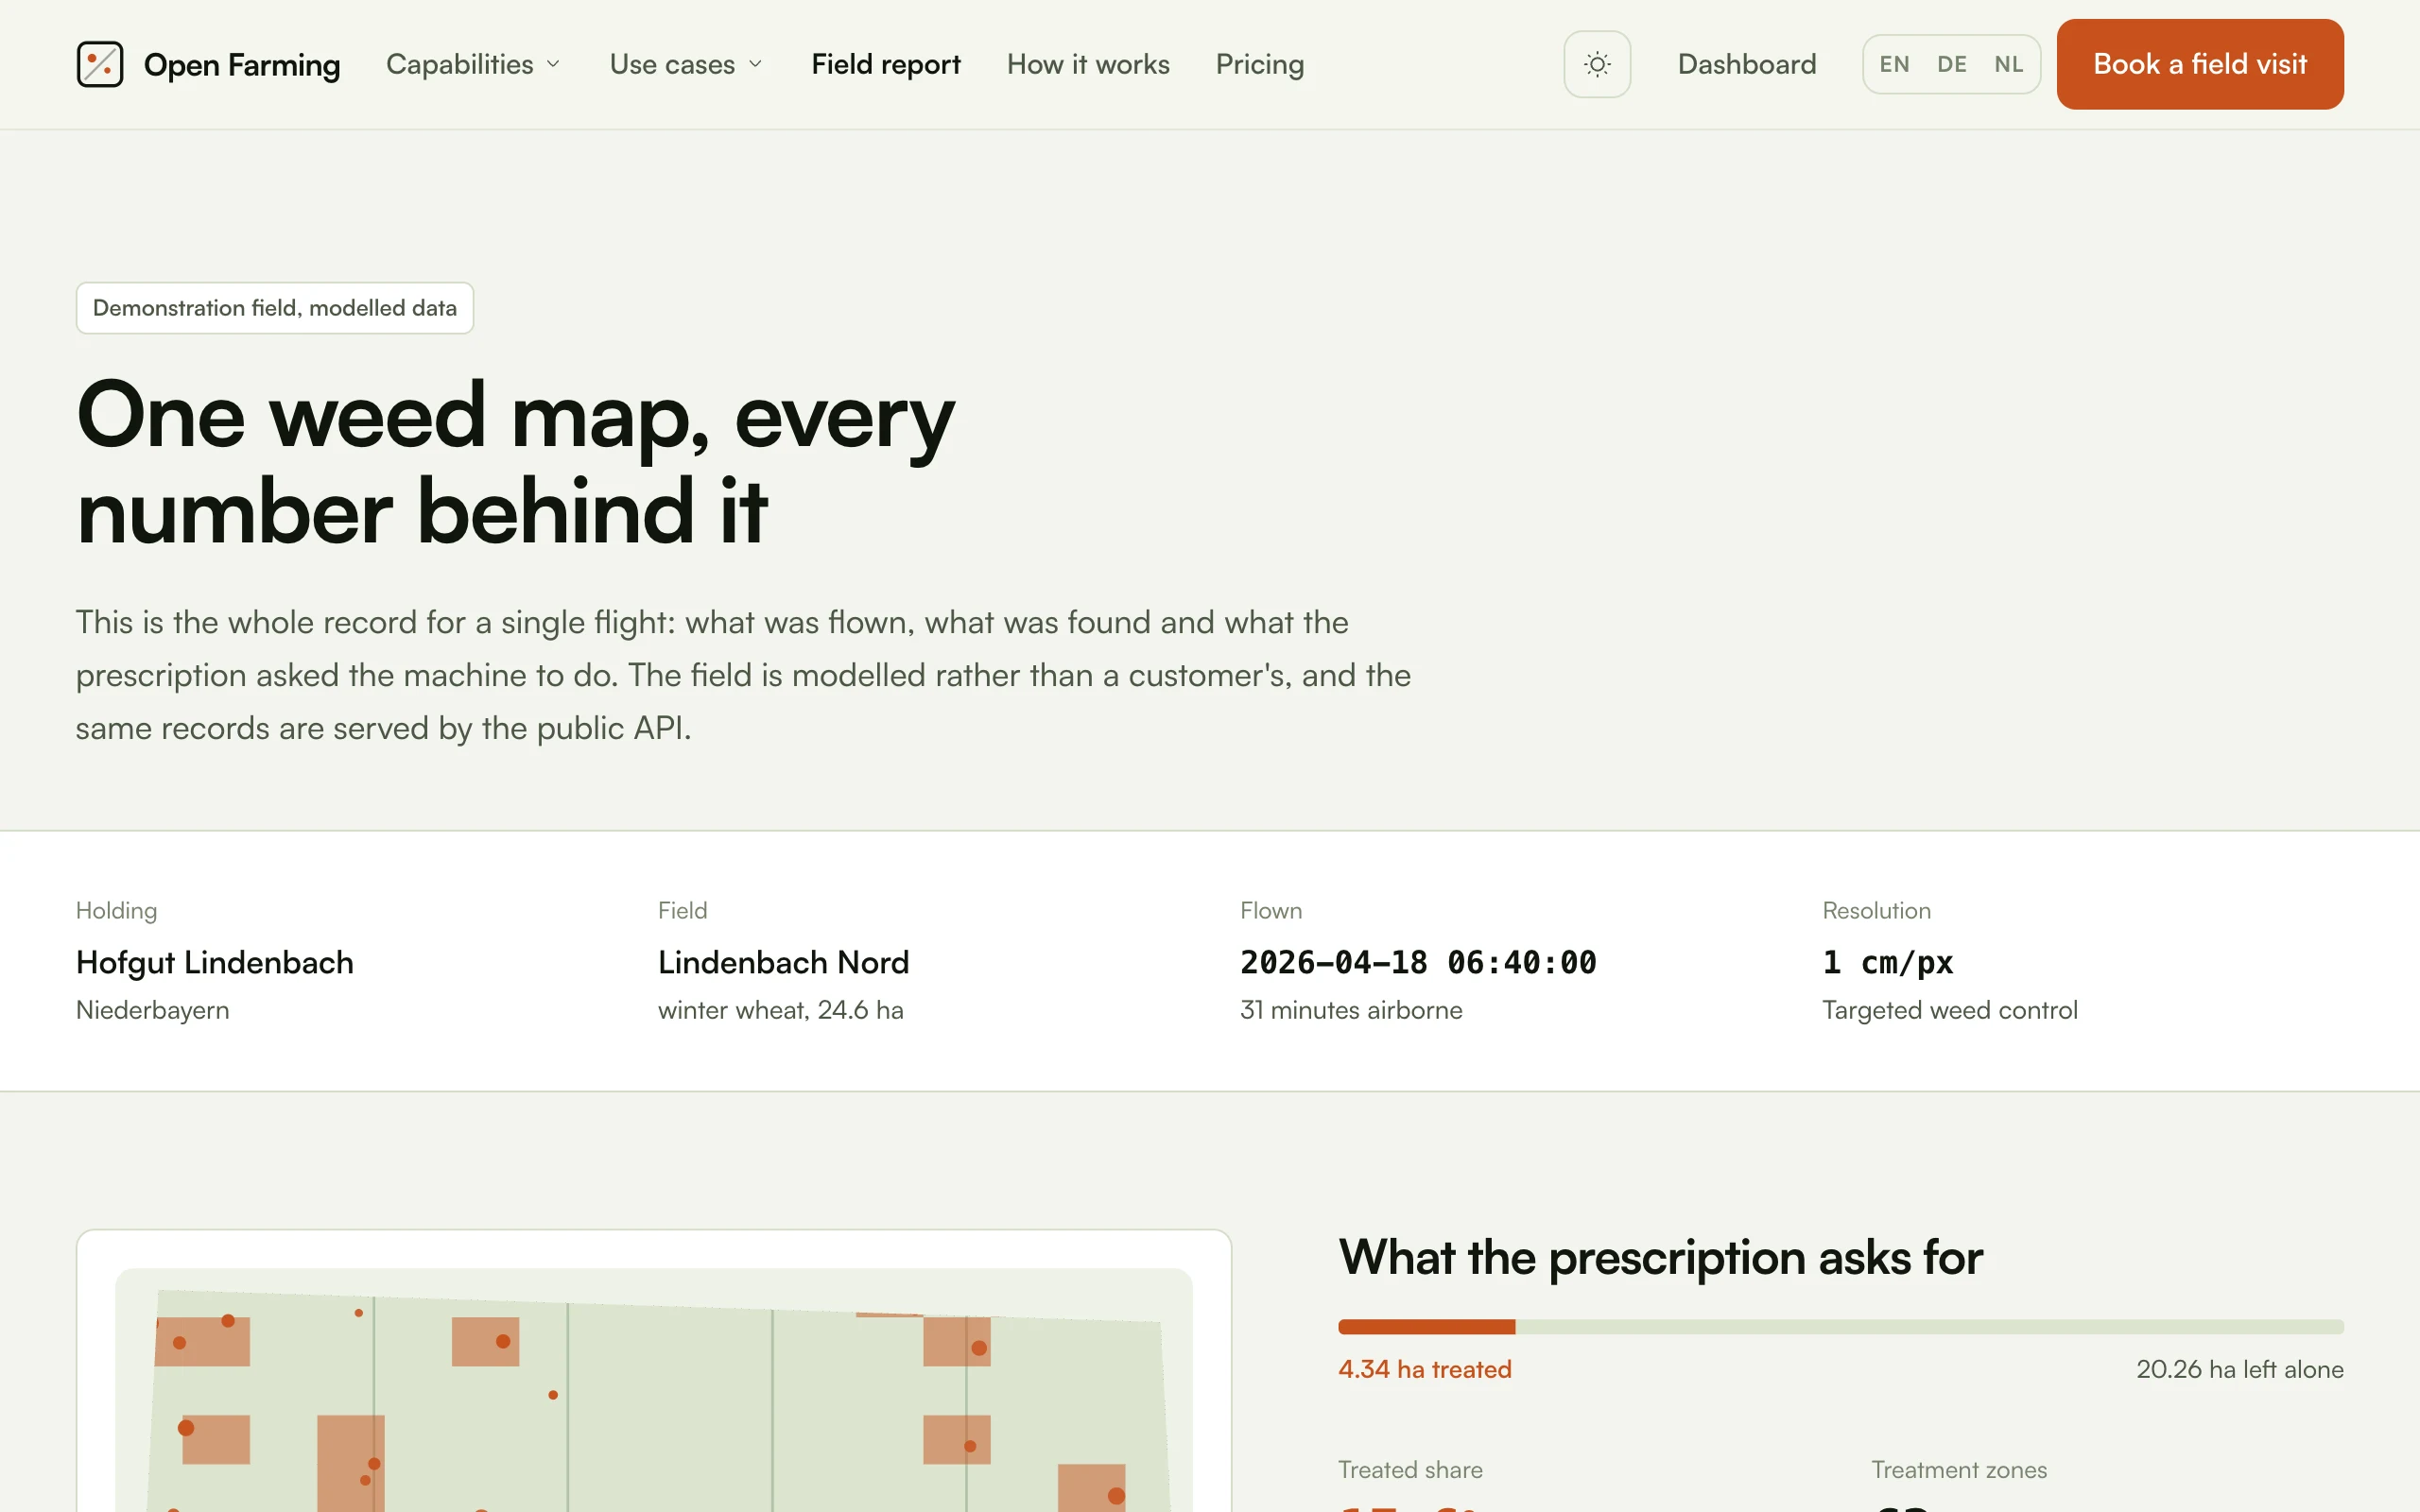
It leads with the chip, not the headline. The holding, the field, the date and
the resolution come straight off the Farm, Field and Mission rows.
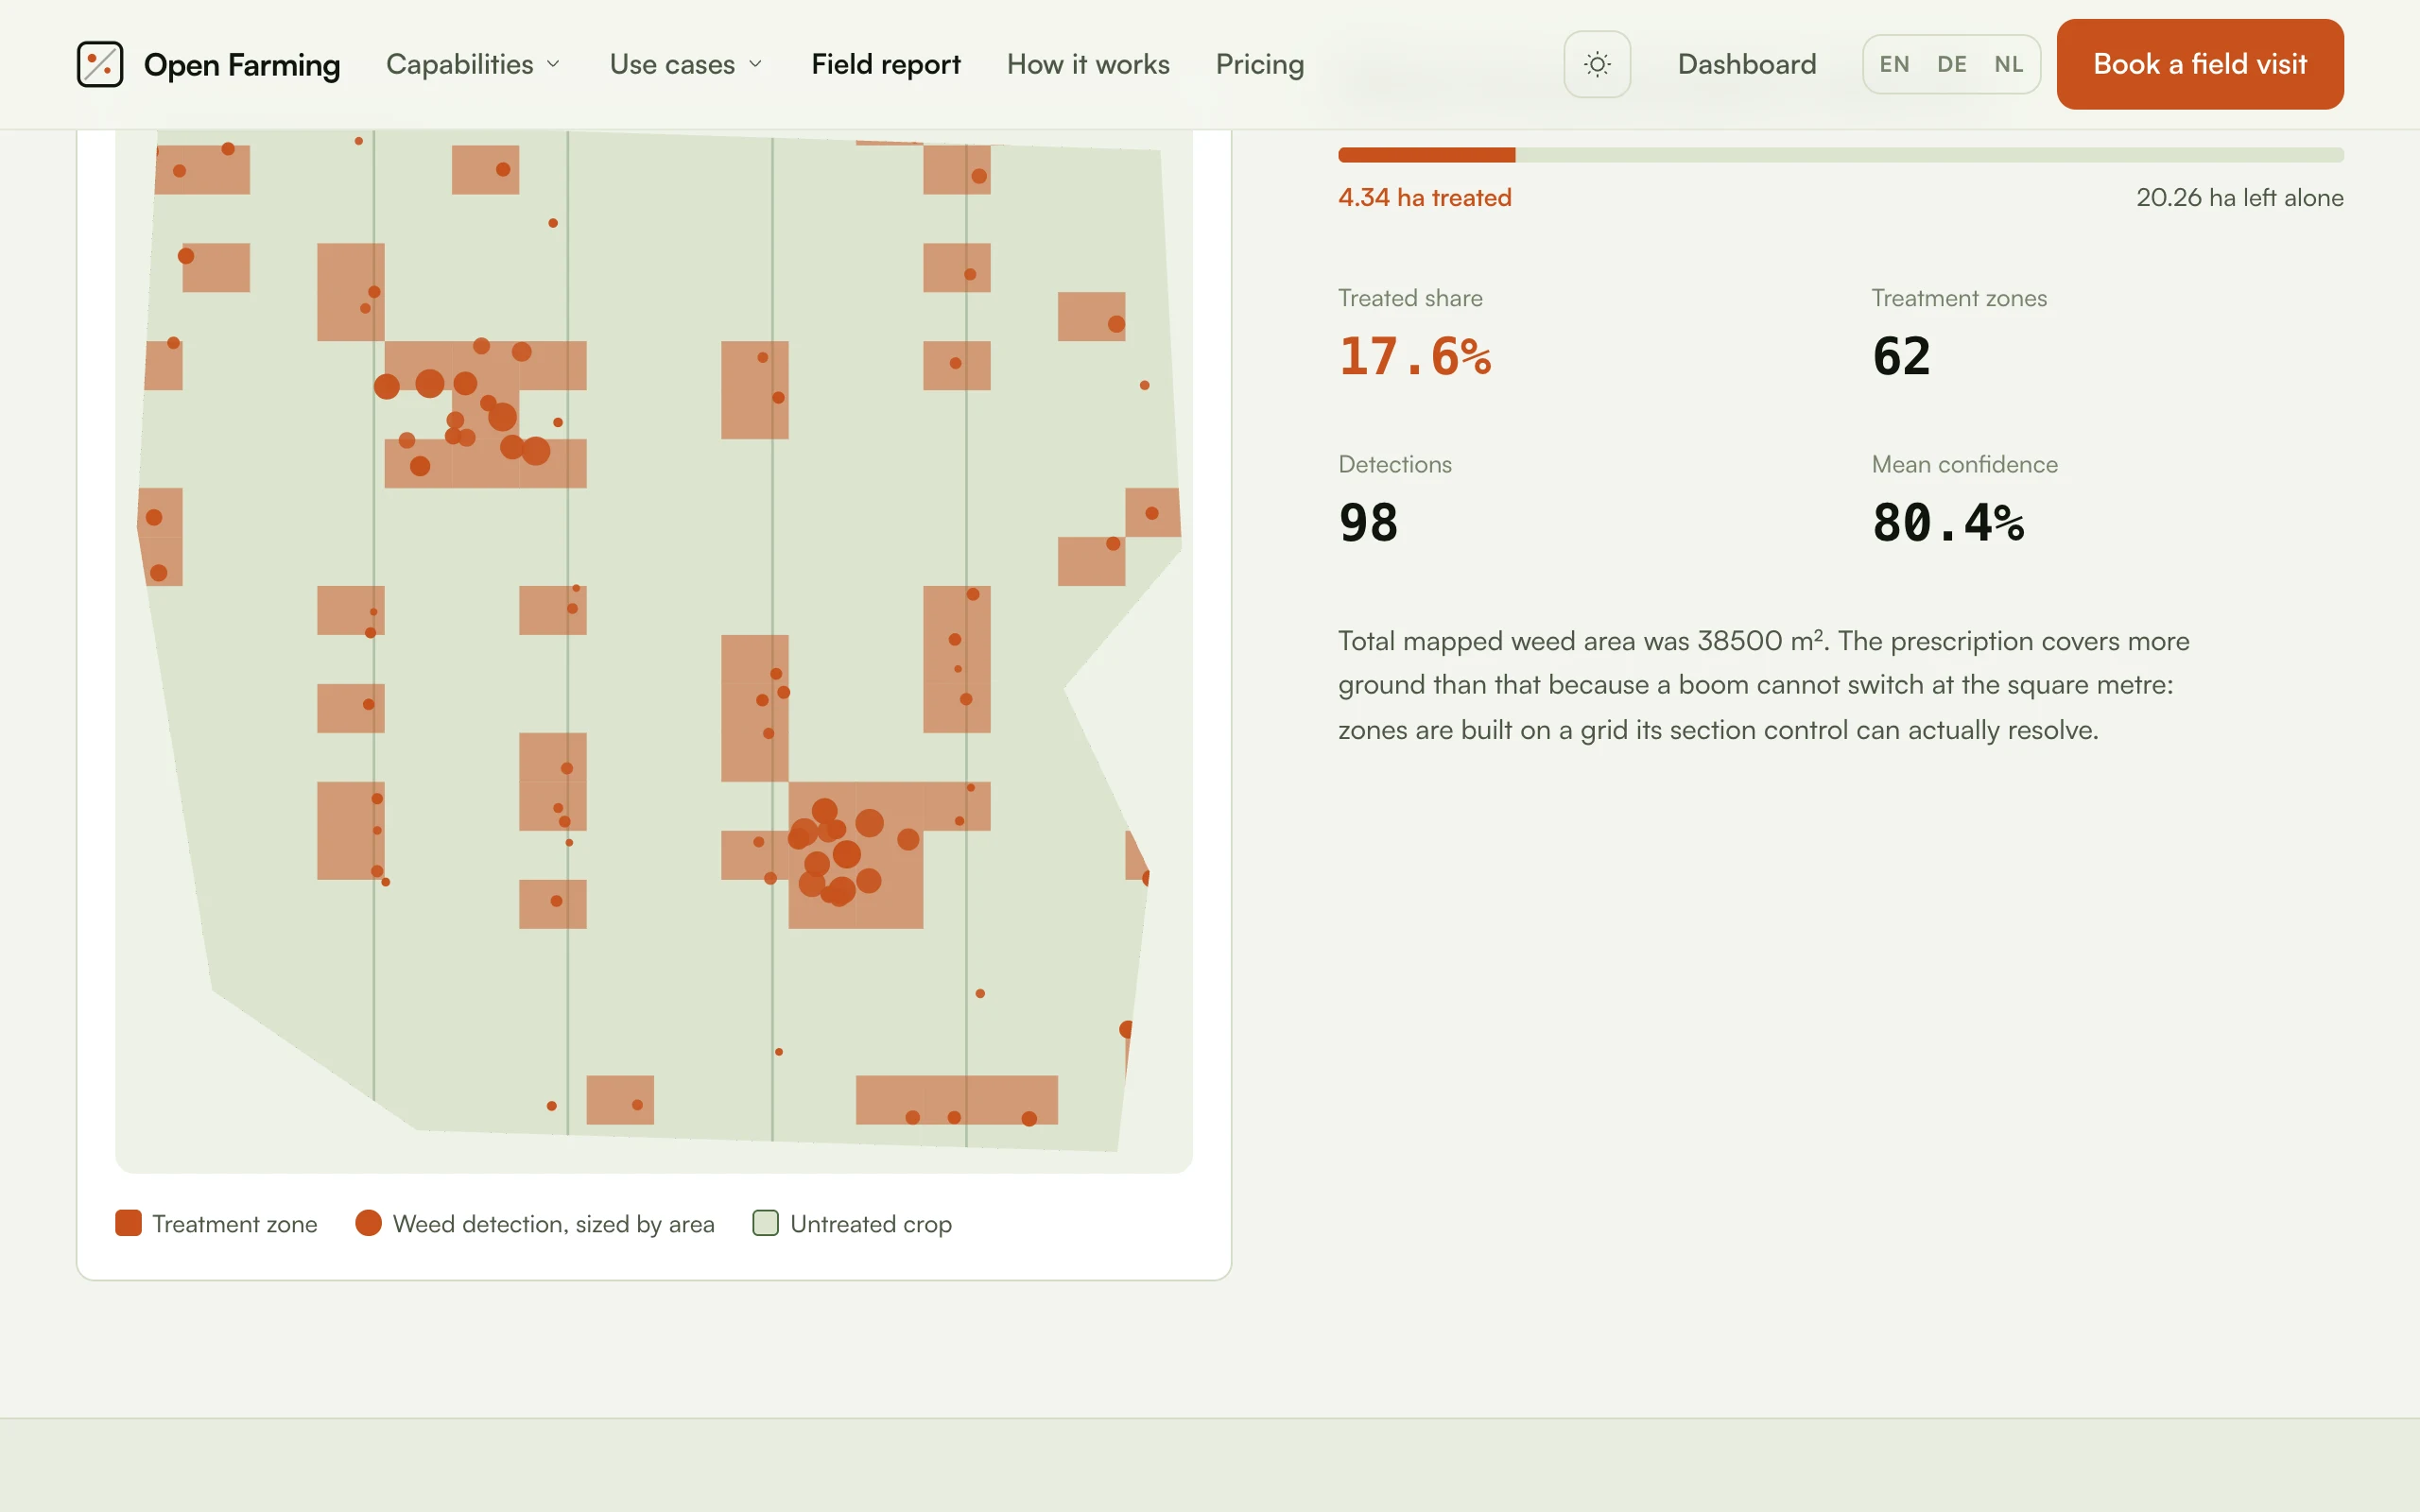
The same SVG the home page draws, at full size, with the numbers derived from the records beside it. The paragraph underneath is the honest caveat: the total mapped weed area was 38,500 m², and the prescription covers more ground than that because a boom cannot switch at the square metre.
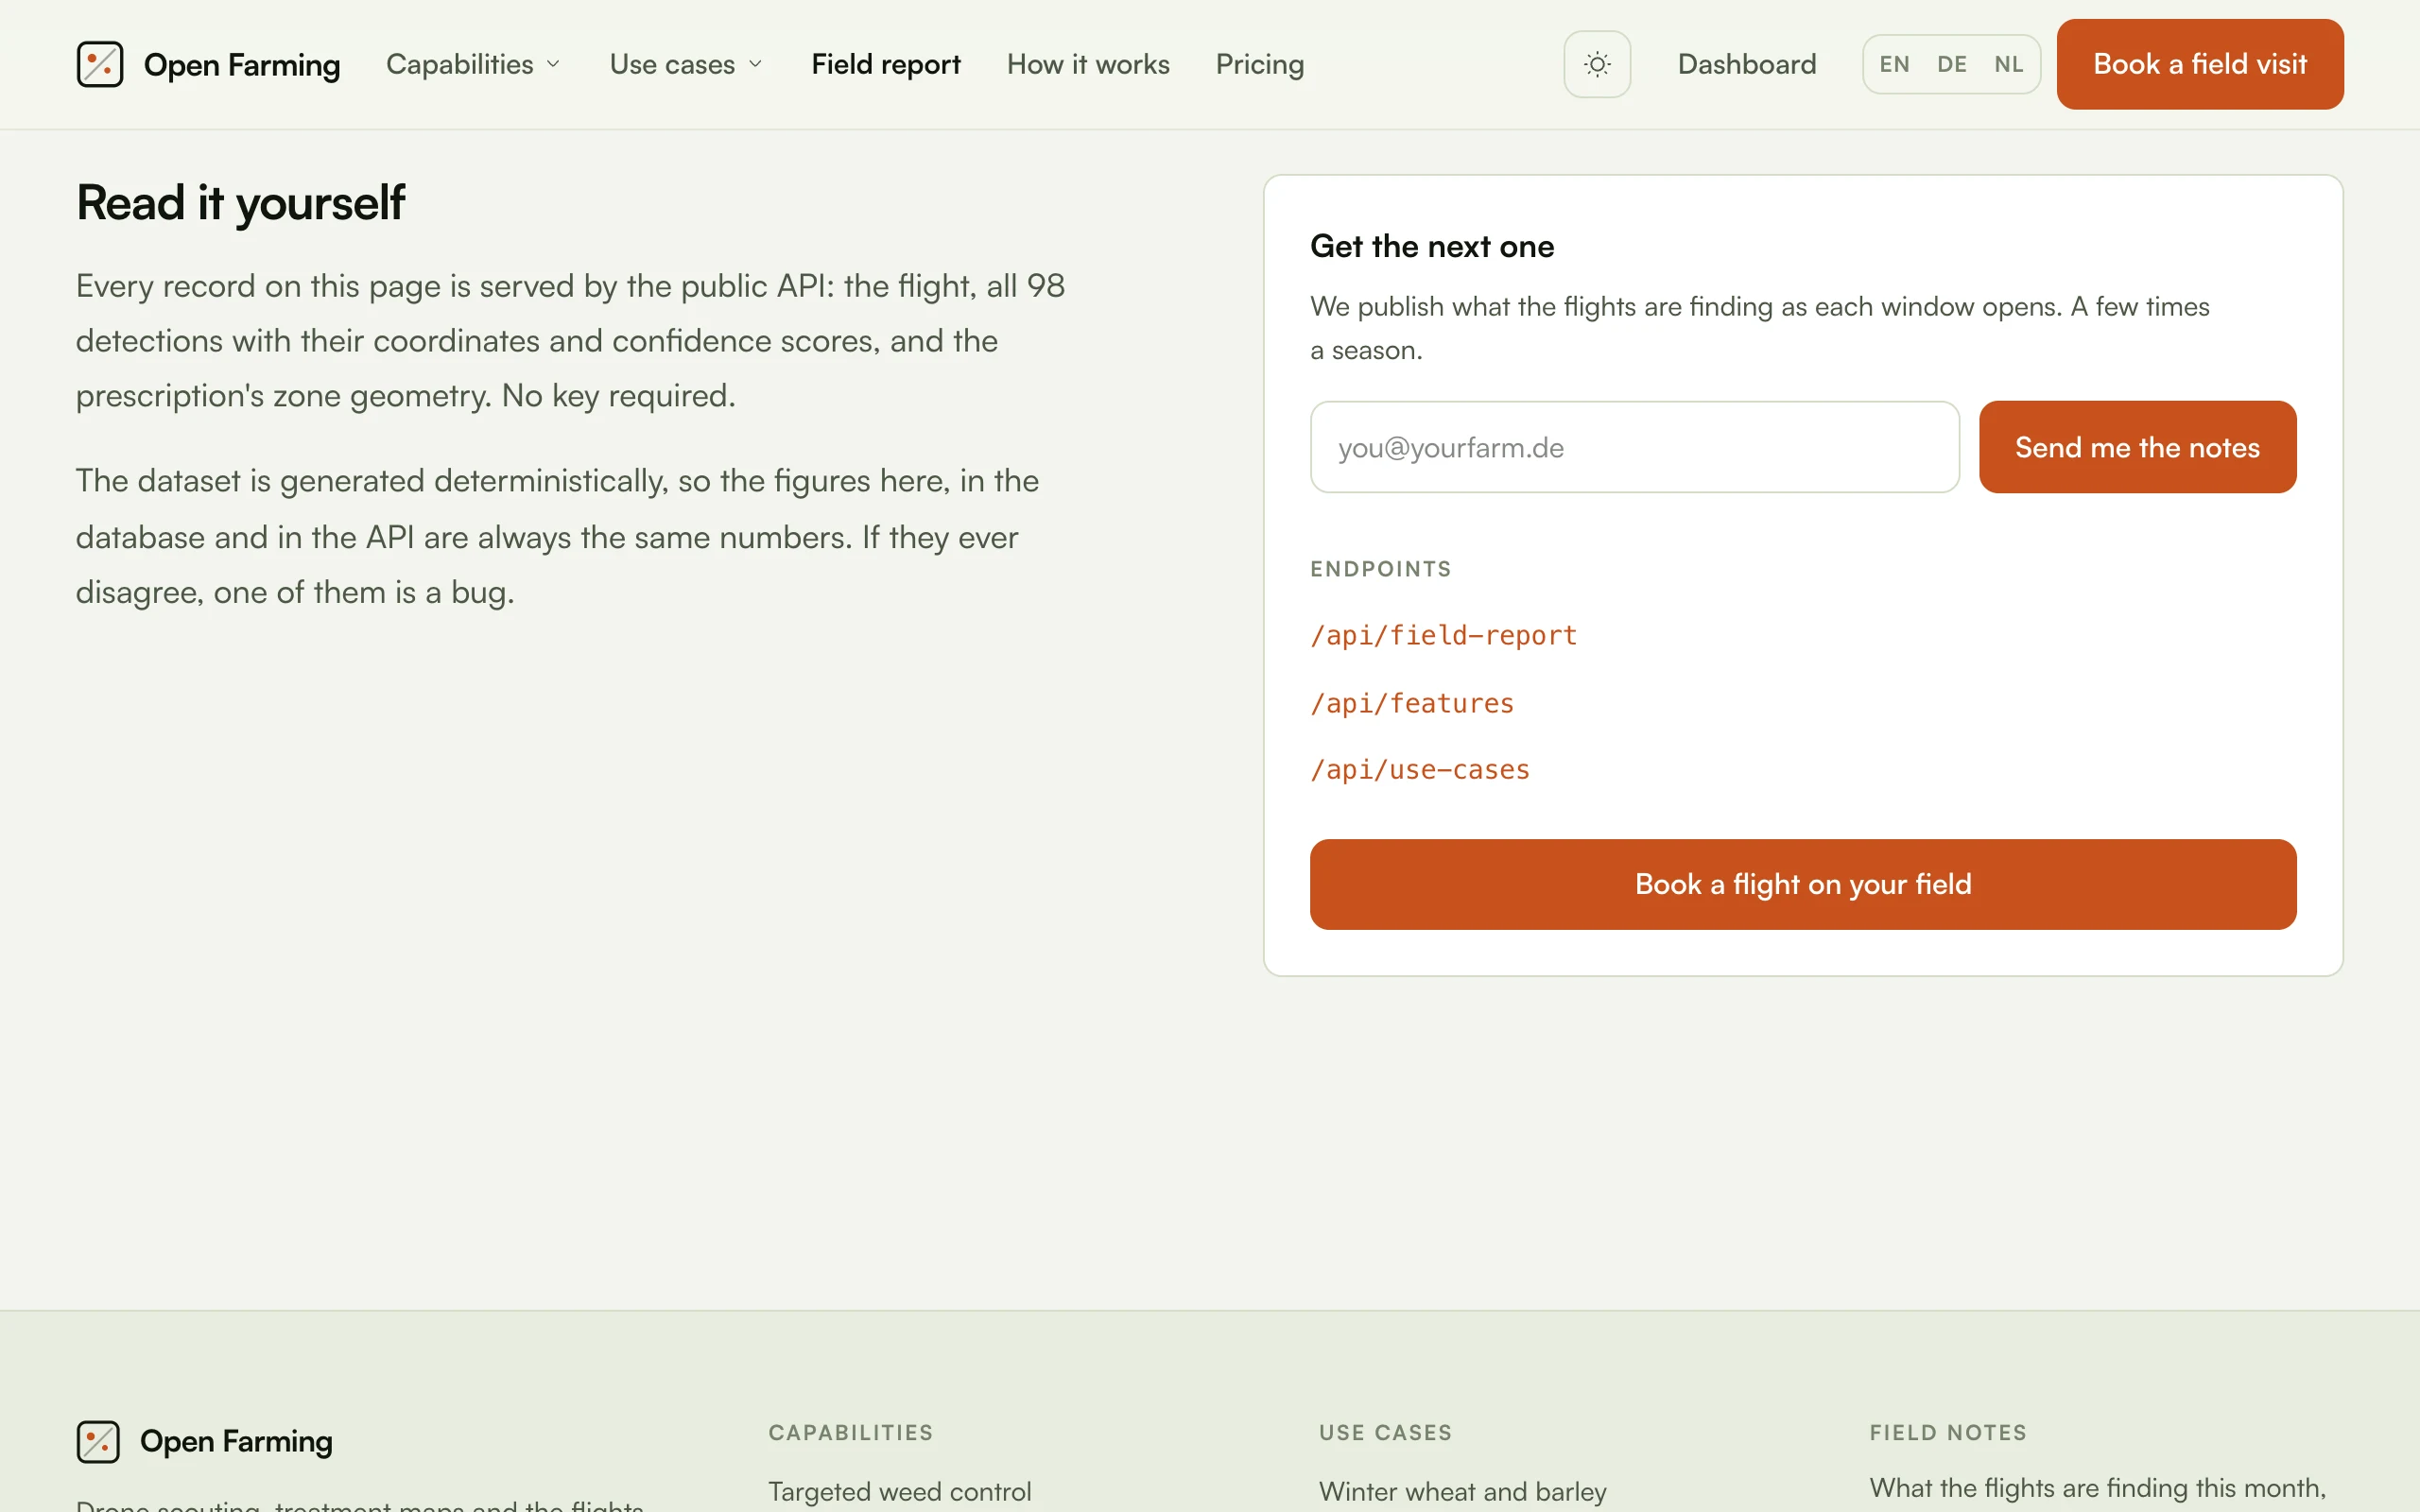
Species and severity, then the part that matters most for anyone integrating: every record on the page is served by the public API, no key required, and because the dataset is generated deterministically the figures on the page, in the database and in the API are always the same numbers. If they ever disagree, one of them is a bug.
The farmer's console
Behind a sign-in. See The farmer console for the rules that govern it.
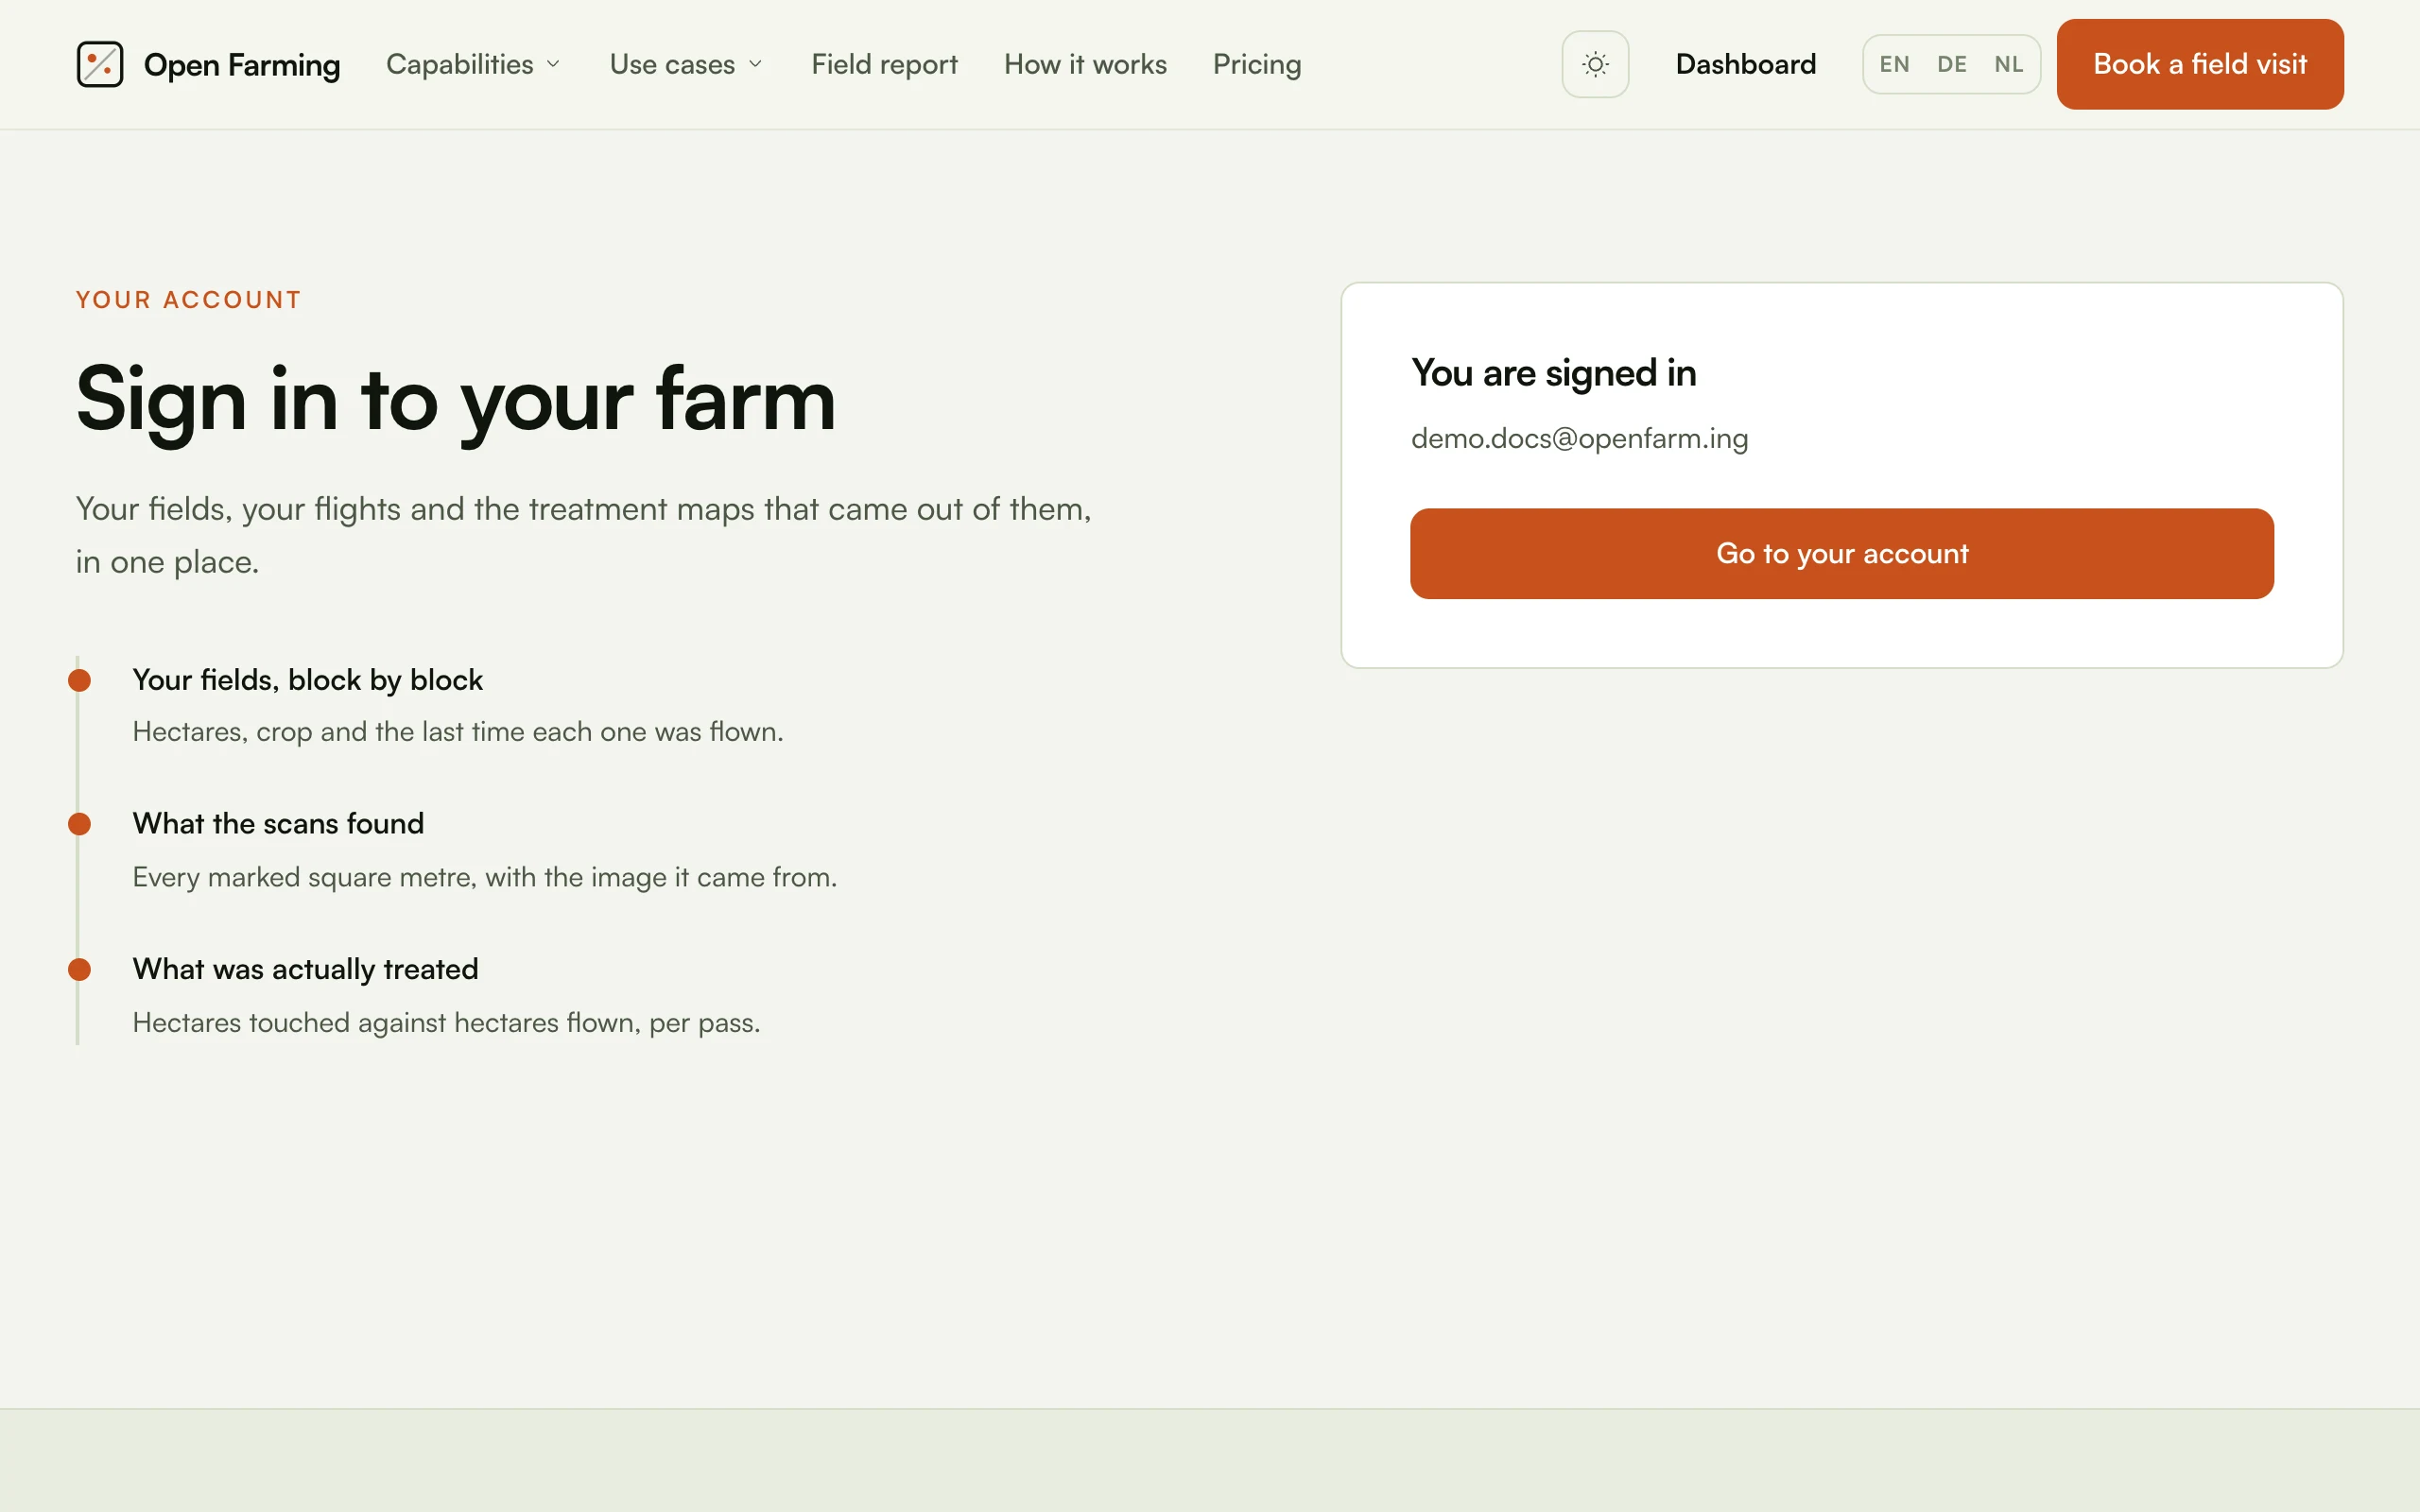
The holding
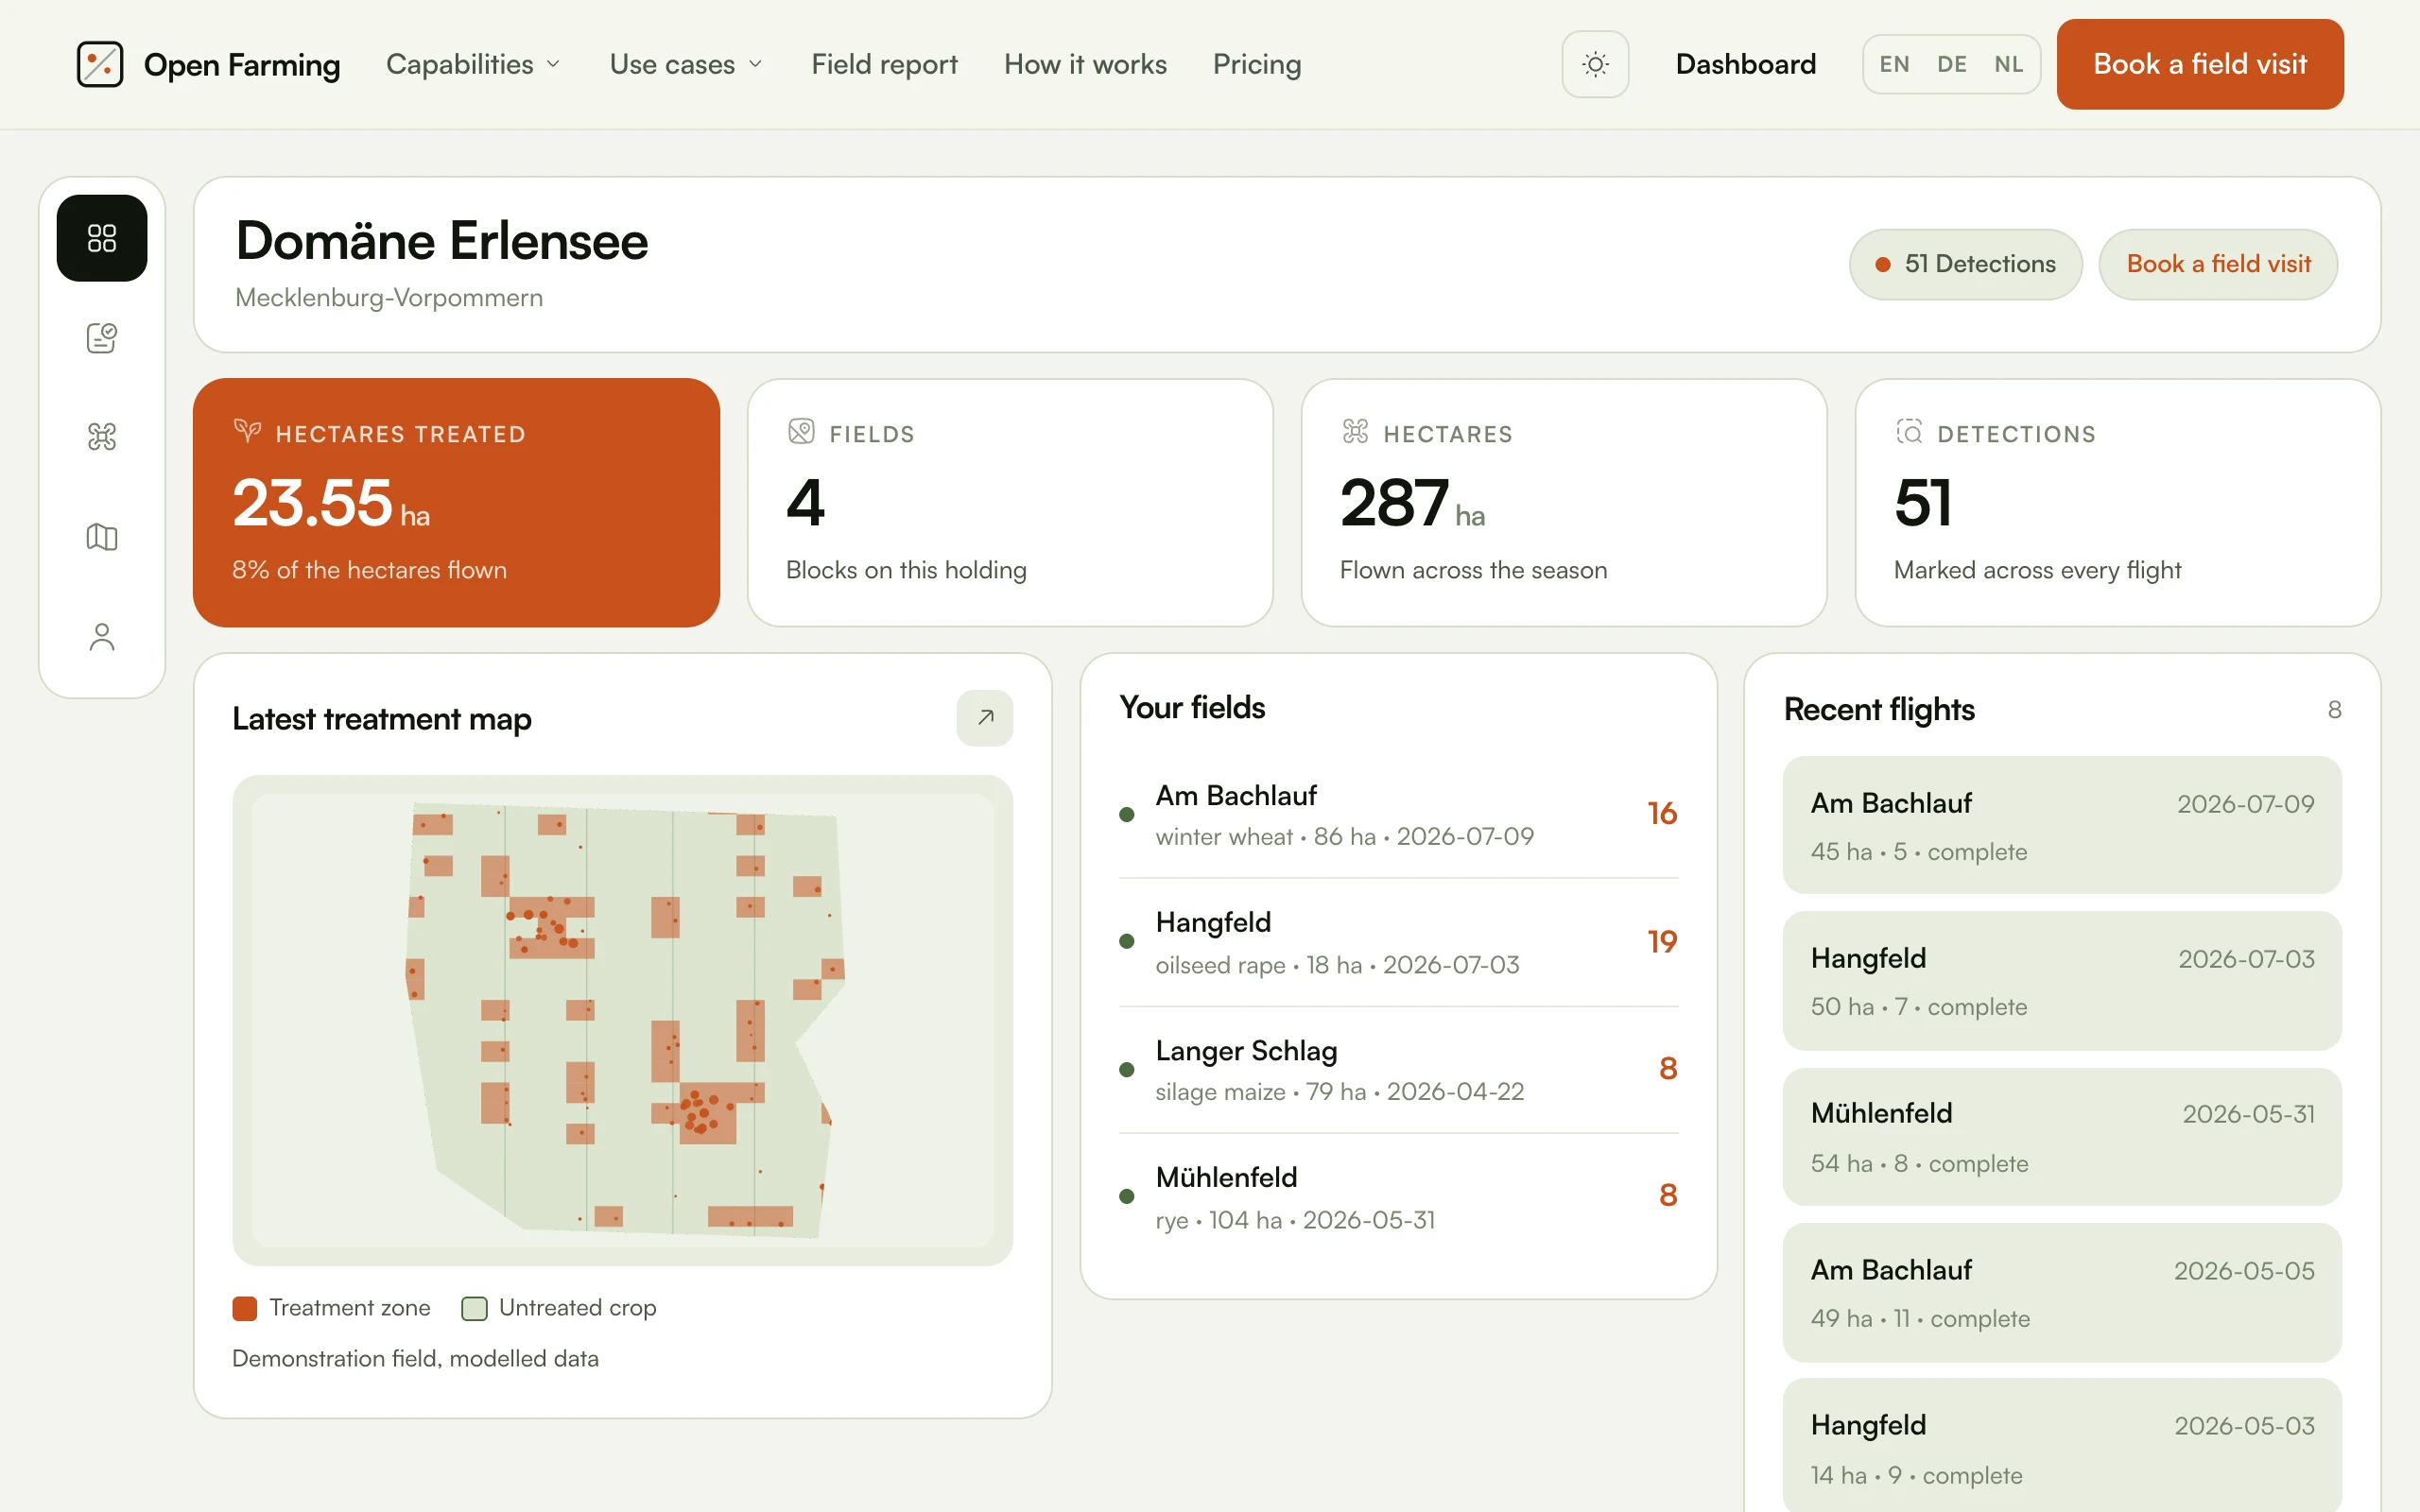
Four figures across the top, all derived from the holding's own records: 23.55 hectares treated, 8% of the hectares flown, 4 fields, 287 hectares, 51 detections. The map panel beside them is the demonstration field, not theirs, so it carries the line "Demonstration field, modelled data" under the legend. Every read on this page re-derives the holding from the signed-in farmer, which is what keeps one customer's console off another's data.
Capabilities, per holding
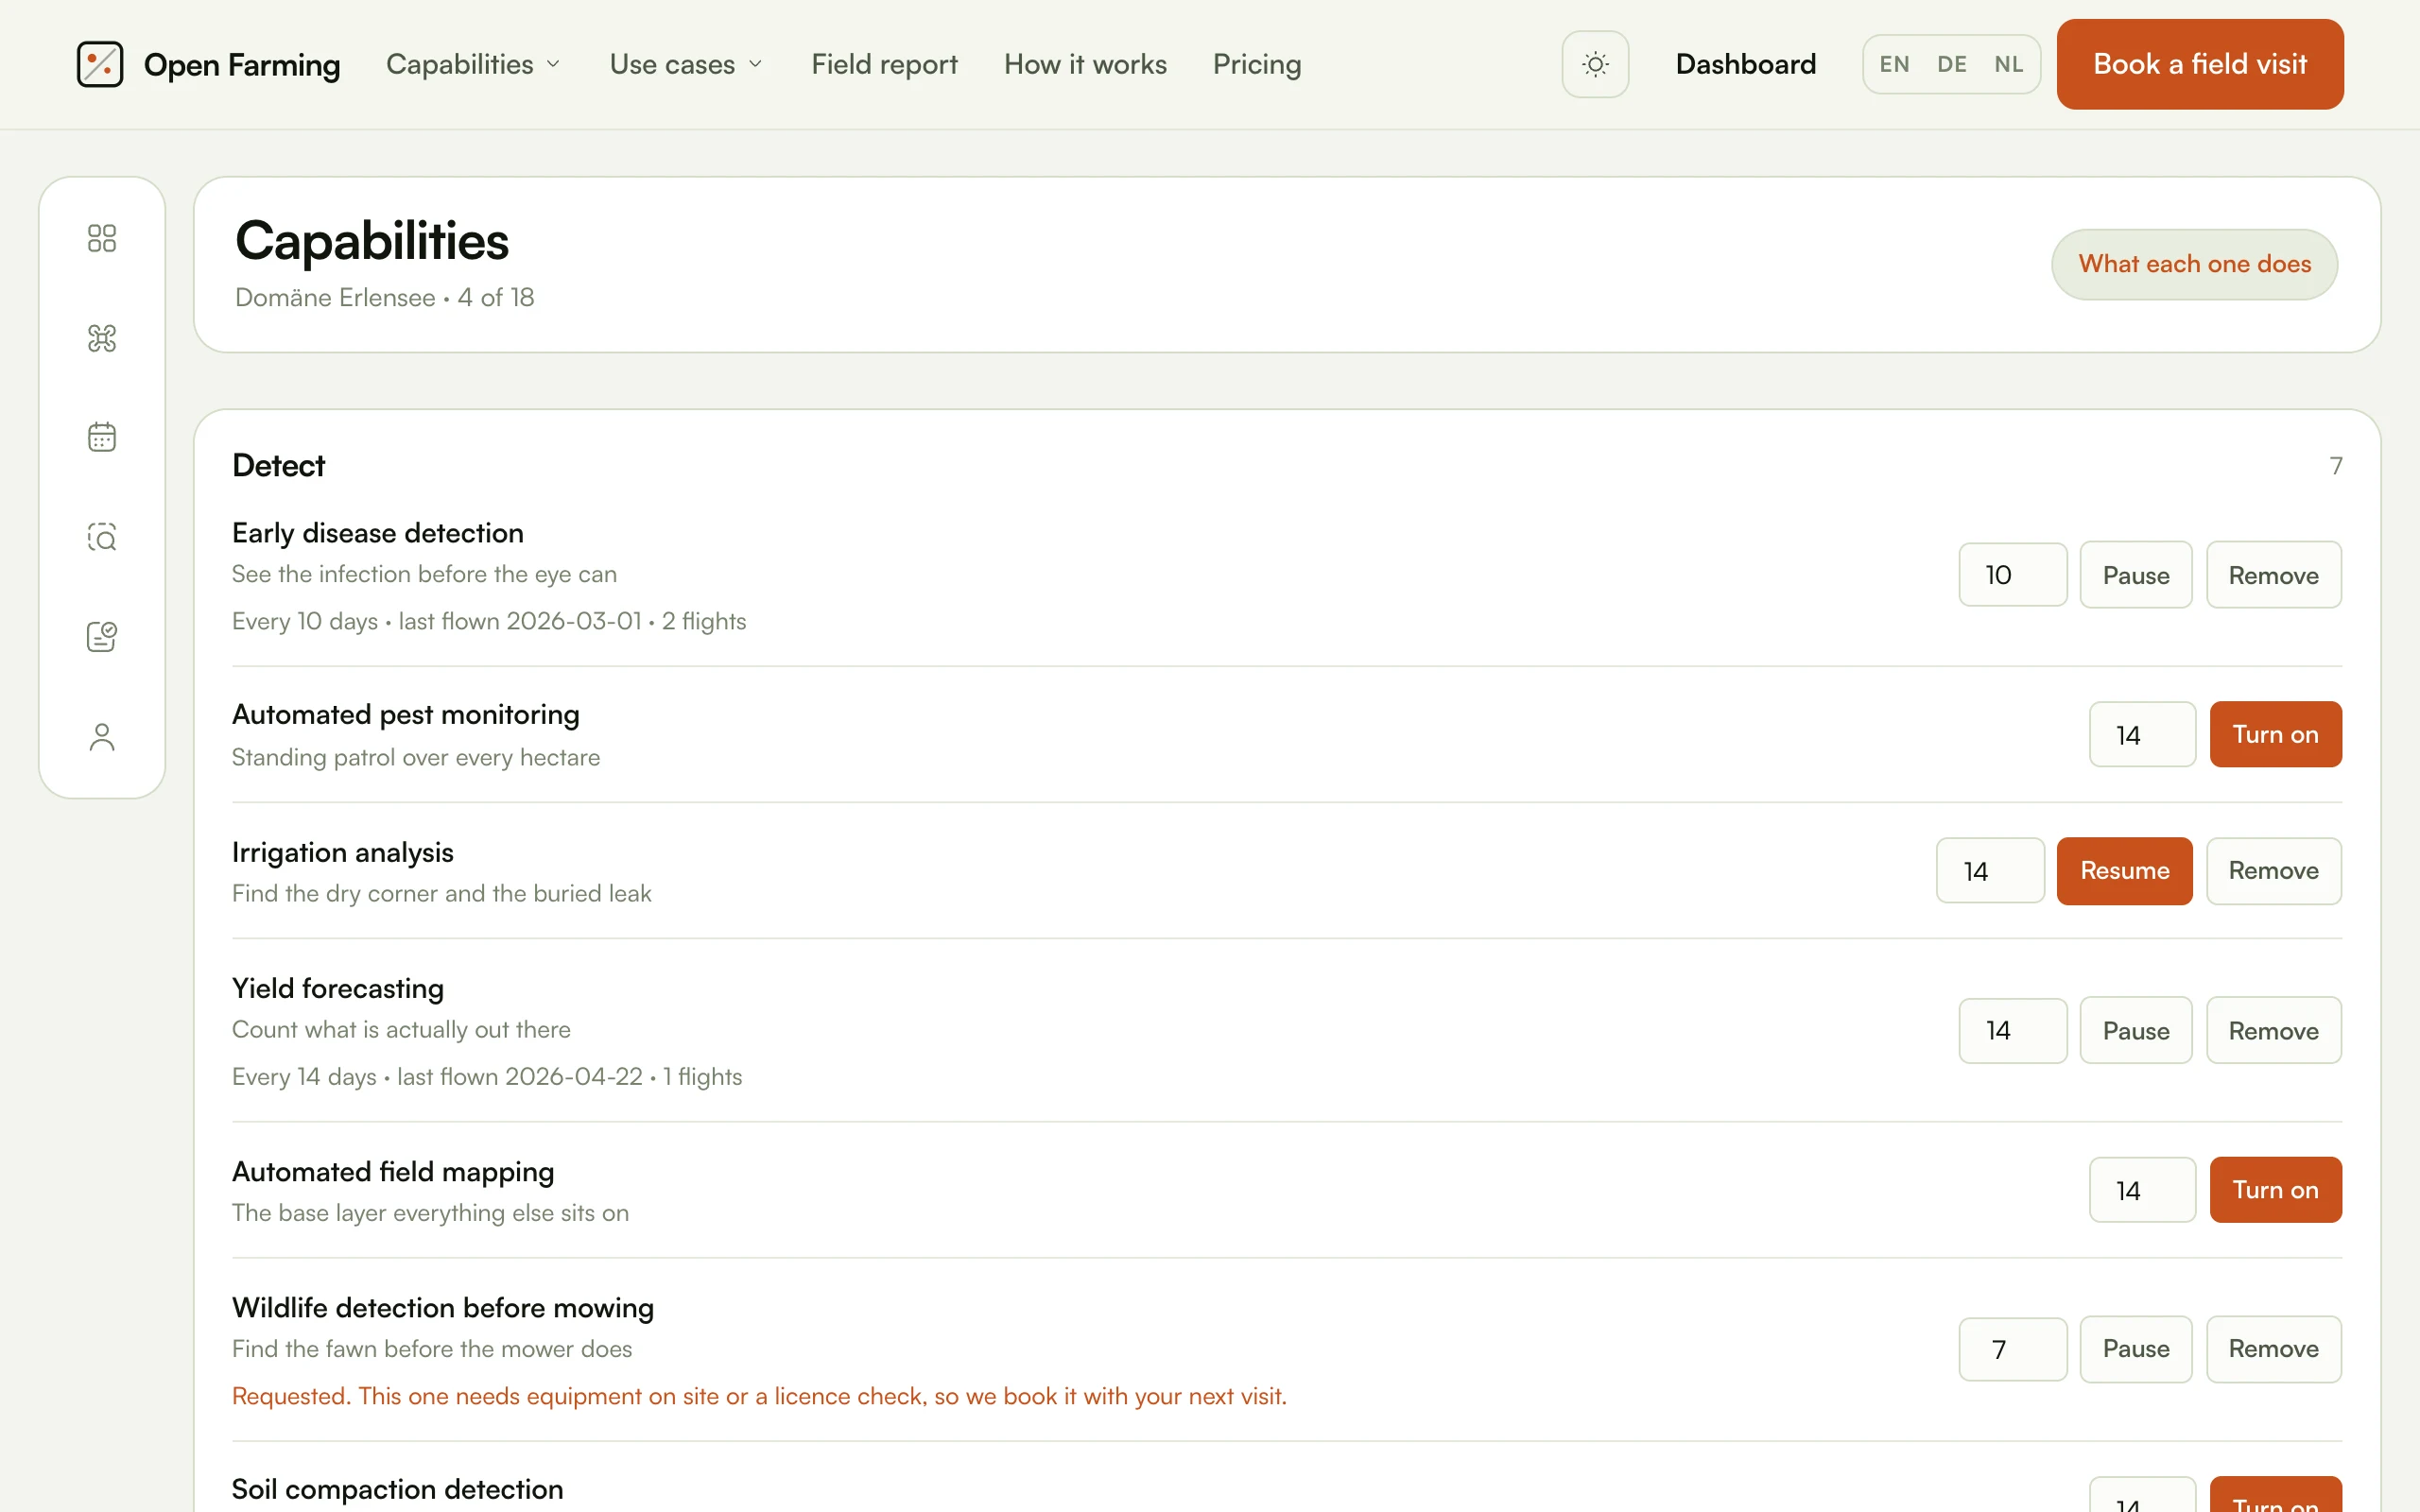
This is app/Support/capabilities.ts made
visible, and the single best illustration of how the catalog and the console
relate. All 18 marketed capabilities appear, whether or not the farm has
switched them on, so the console can never quietly offer less than the site
advertises. The header reads "4 of 18".
Four states are visible at once:
| What you see | State |
|---|---|
| "Every 10 days · last flown 2026-03-01 · 2 flights", with Pause and Remove | active |
| A cadence box and a Turn on button | off, the default for everything |
| A Resume button | paused |
| "Requested. This one needs equipment on site or a licence check, so we book it with your next visit." | requested |
That last one is wildlife detection, and it is not a rejection: five capabilities need a visit first because they need equipment on site or a licence check, so turning one on records a request rather than promising a flight the schedule cannot keep.
Flights
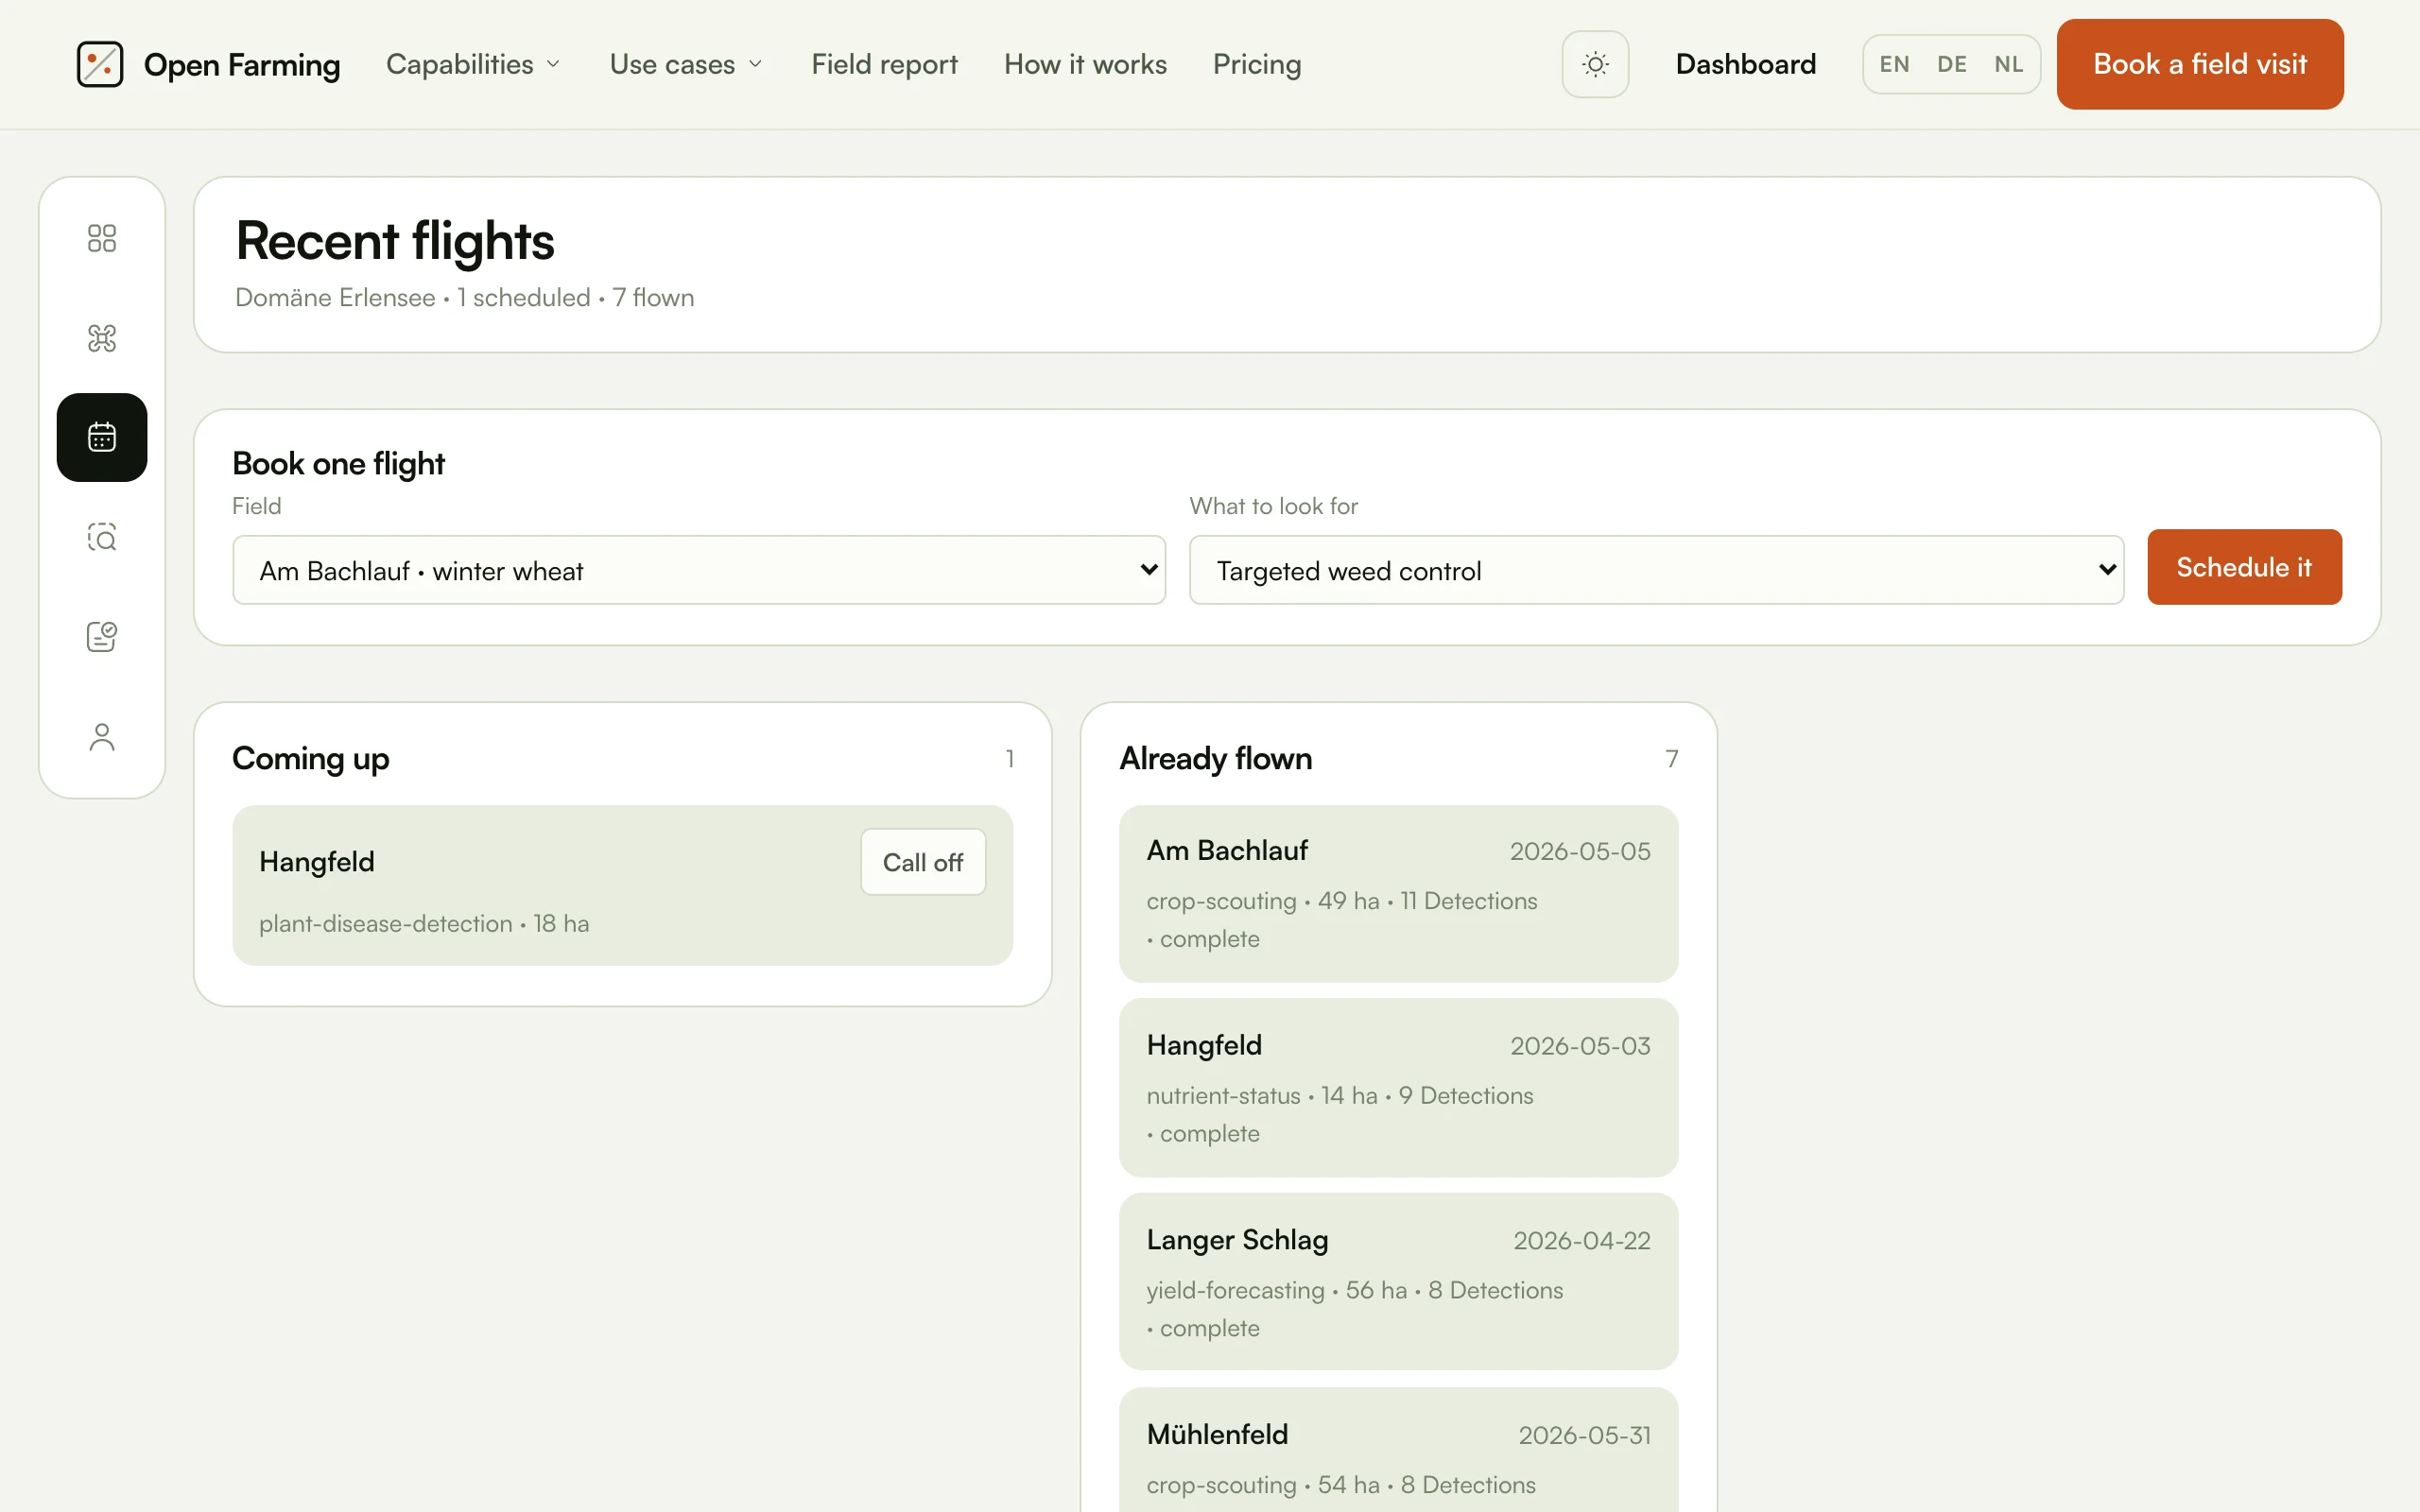
The cadence puts most flights on the calendar by itself, overnight. This page
is for the one that is out of cycle: pick a field, pick what to look for, and
the picker offers exactly the capabilities the content module defines, so a
form cannot offer something that does not exist. A scheduled flight can be
called off, which records weather_cancelled rather than deleting the row,
because a missed flight with a reason is a better record than a gap.
Detections
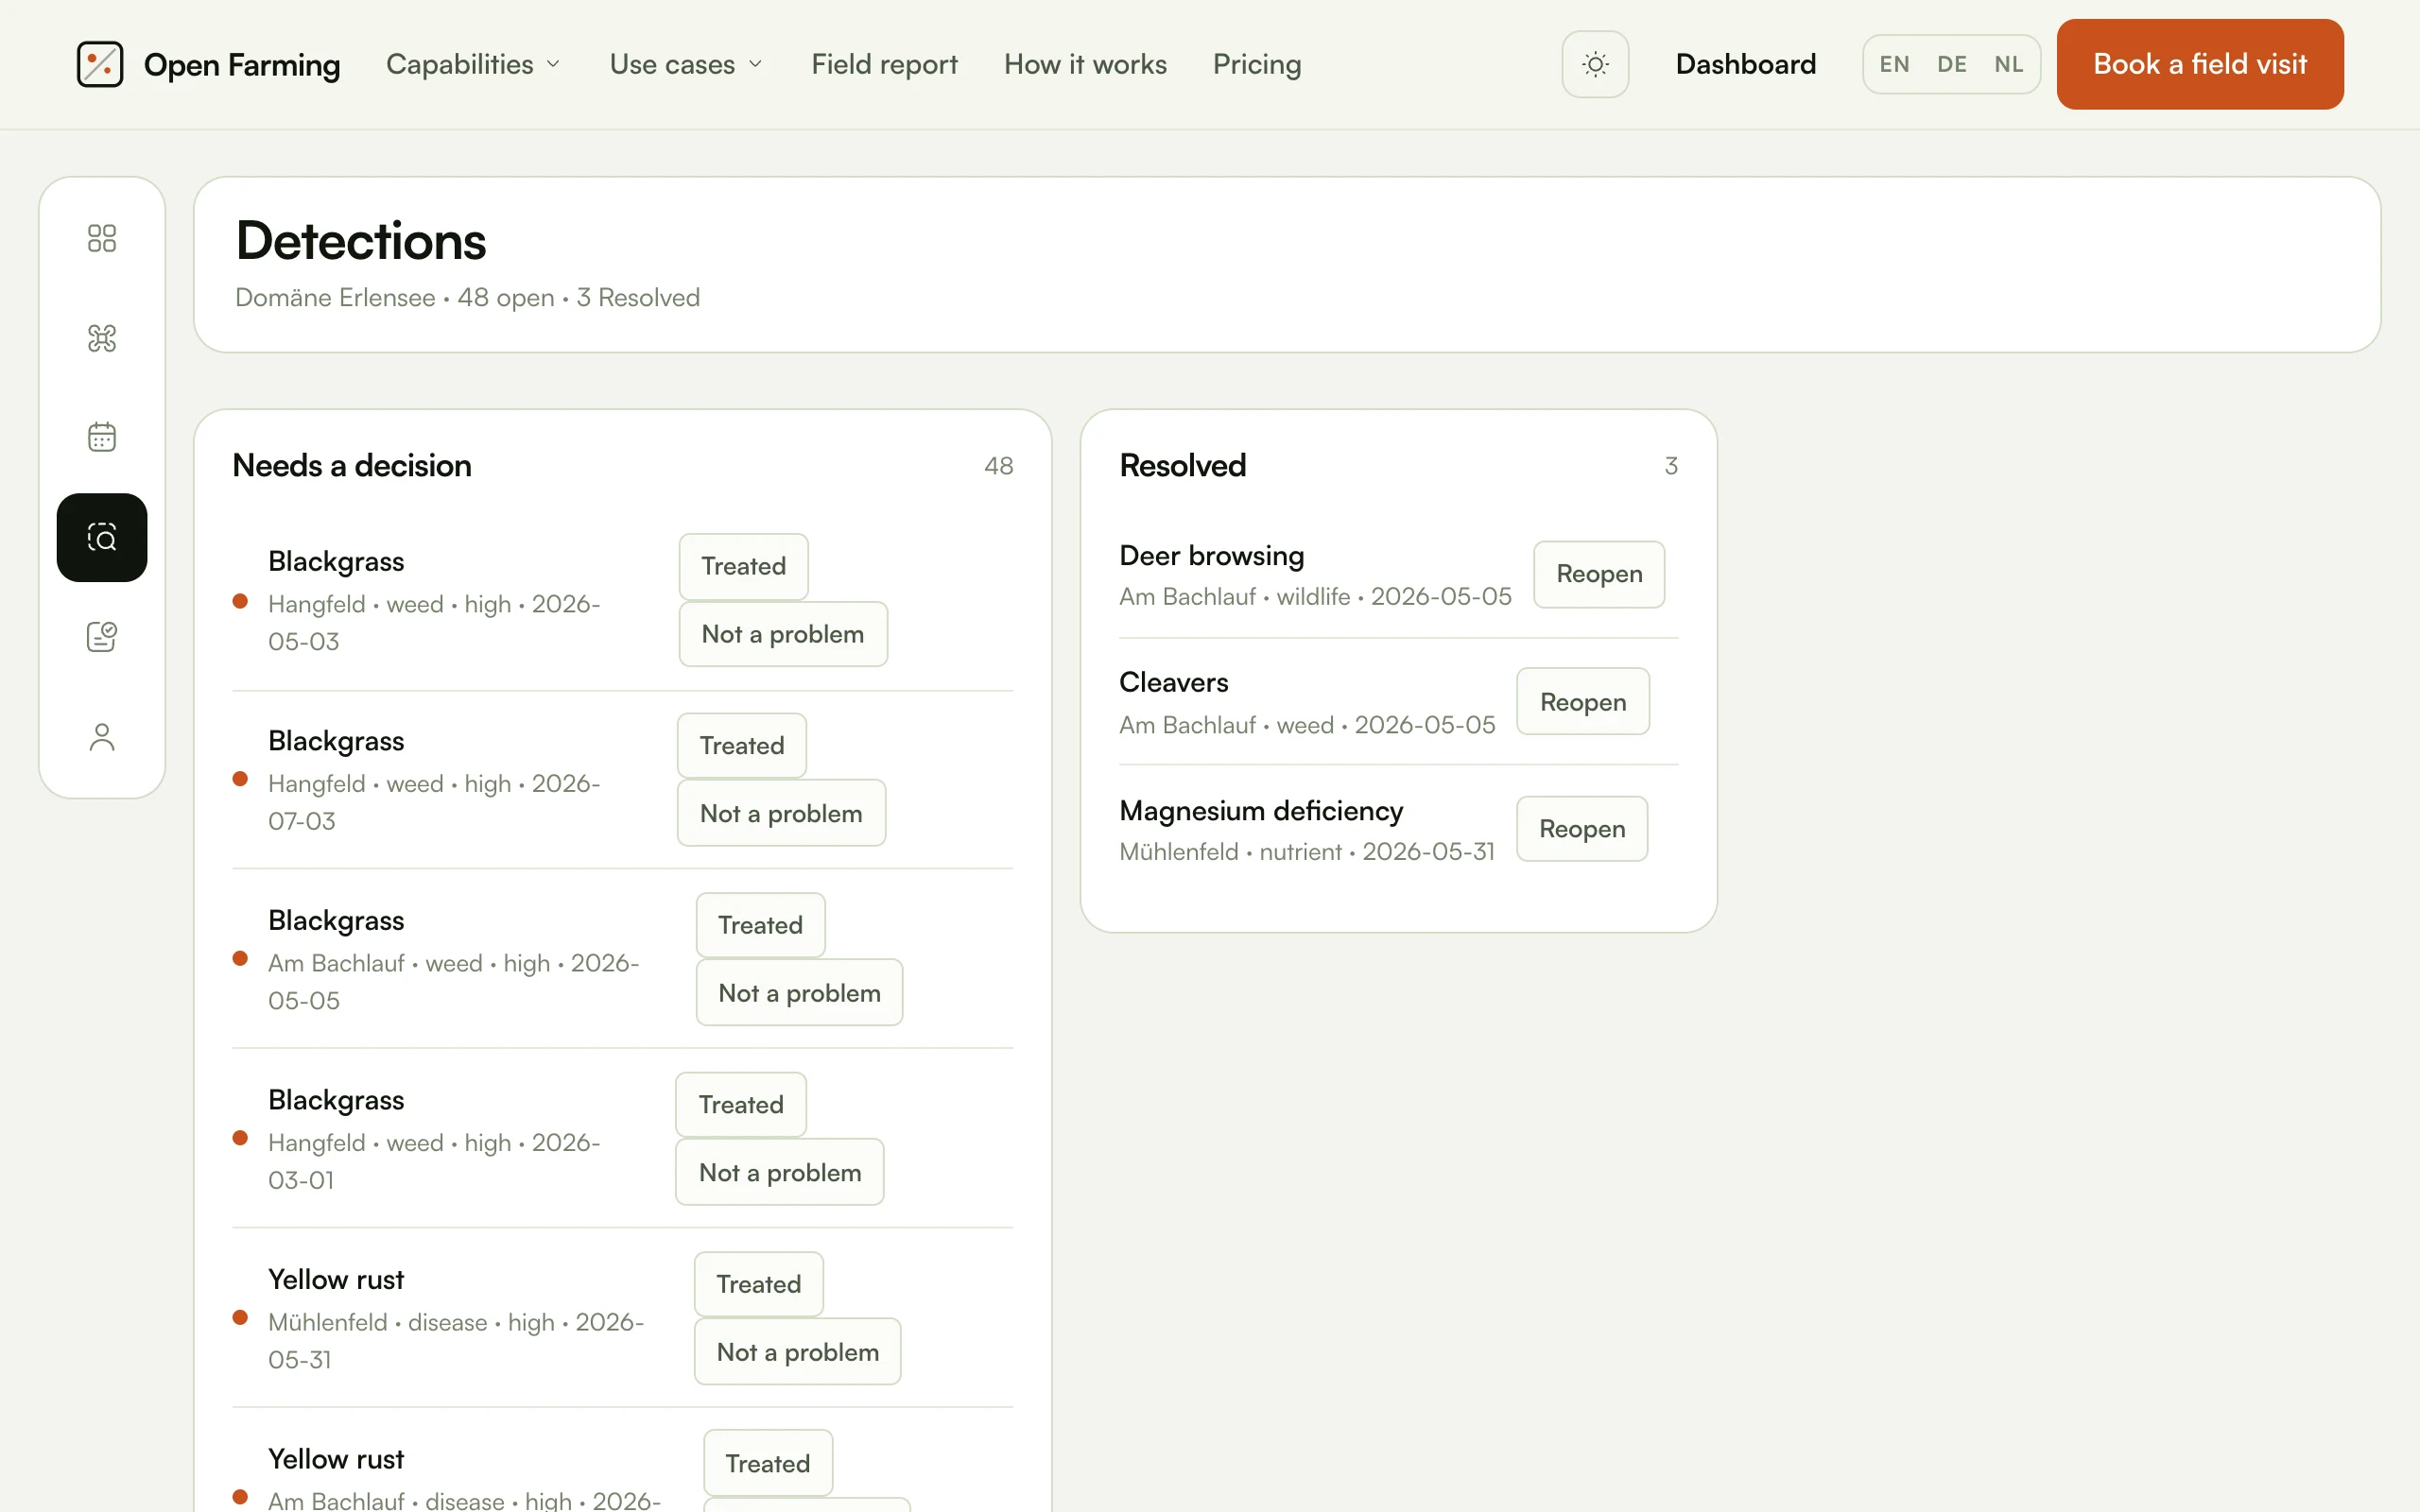
Every finding, with the field, the kind, the severity and the date, and two ways to close it. "Not a problem" matters as much as "Treated": a finding the farmer rejects is feedback about the model, and it belongs in the record rather than being silently dismissed. See Perception models.
Account
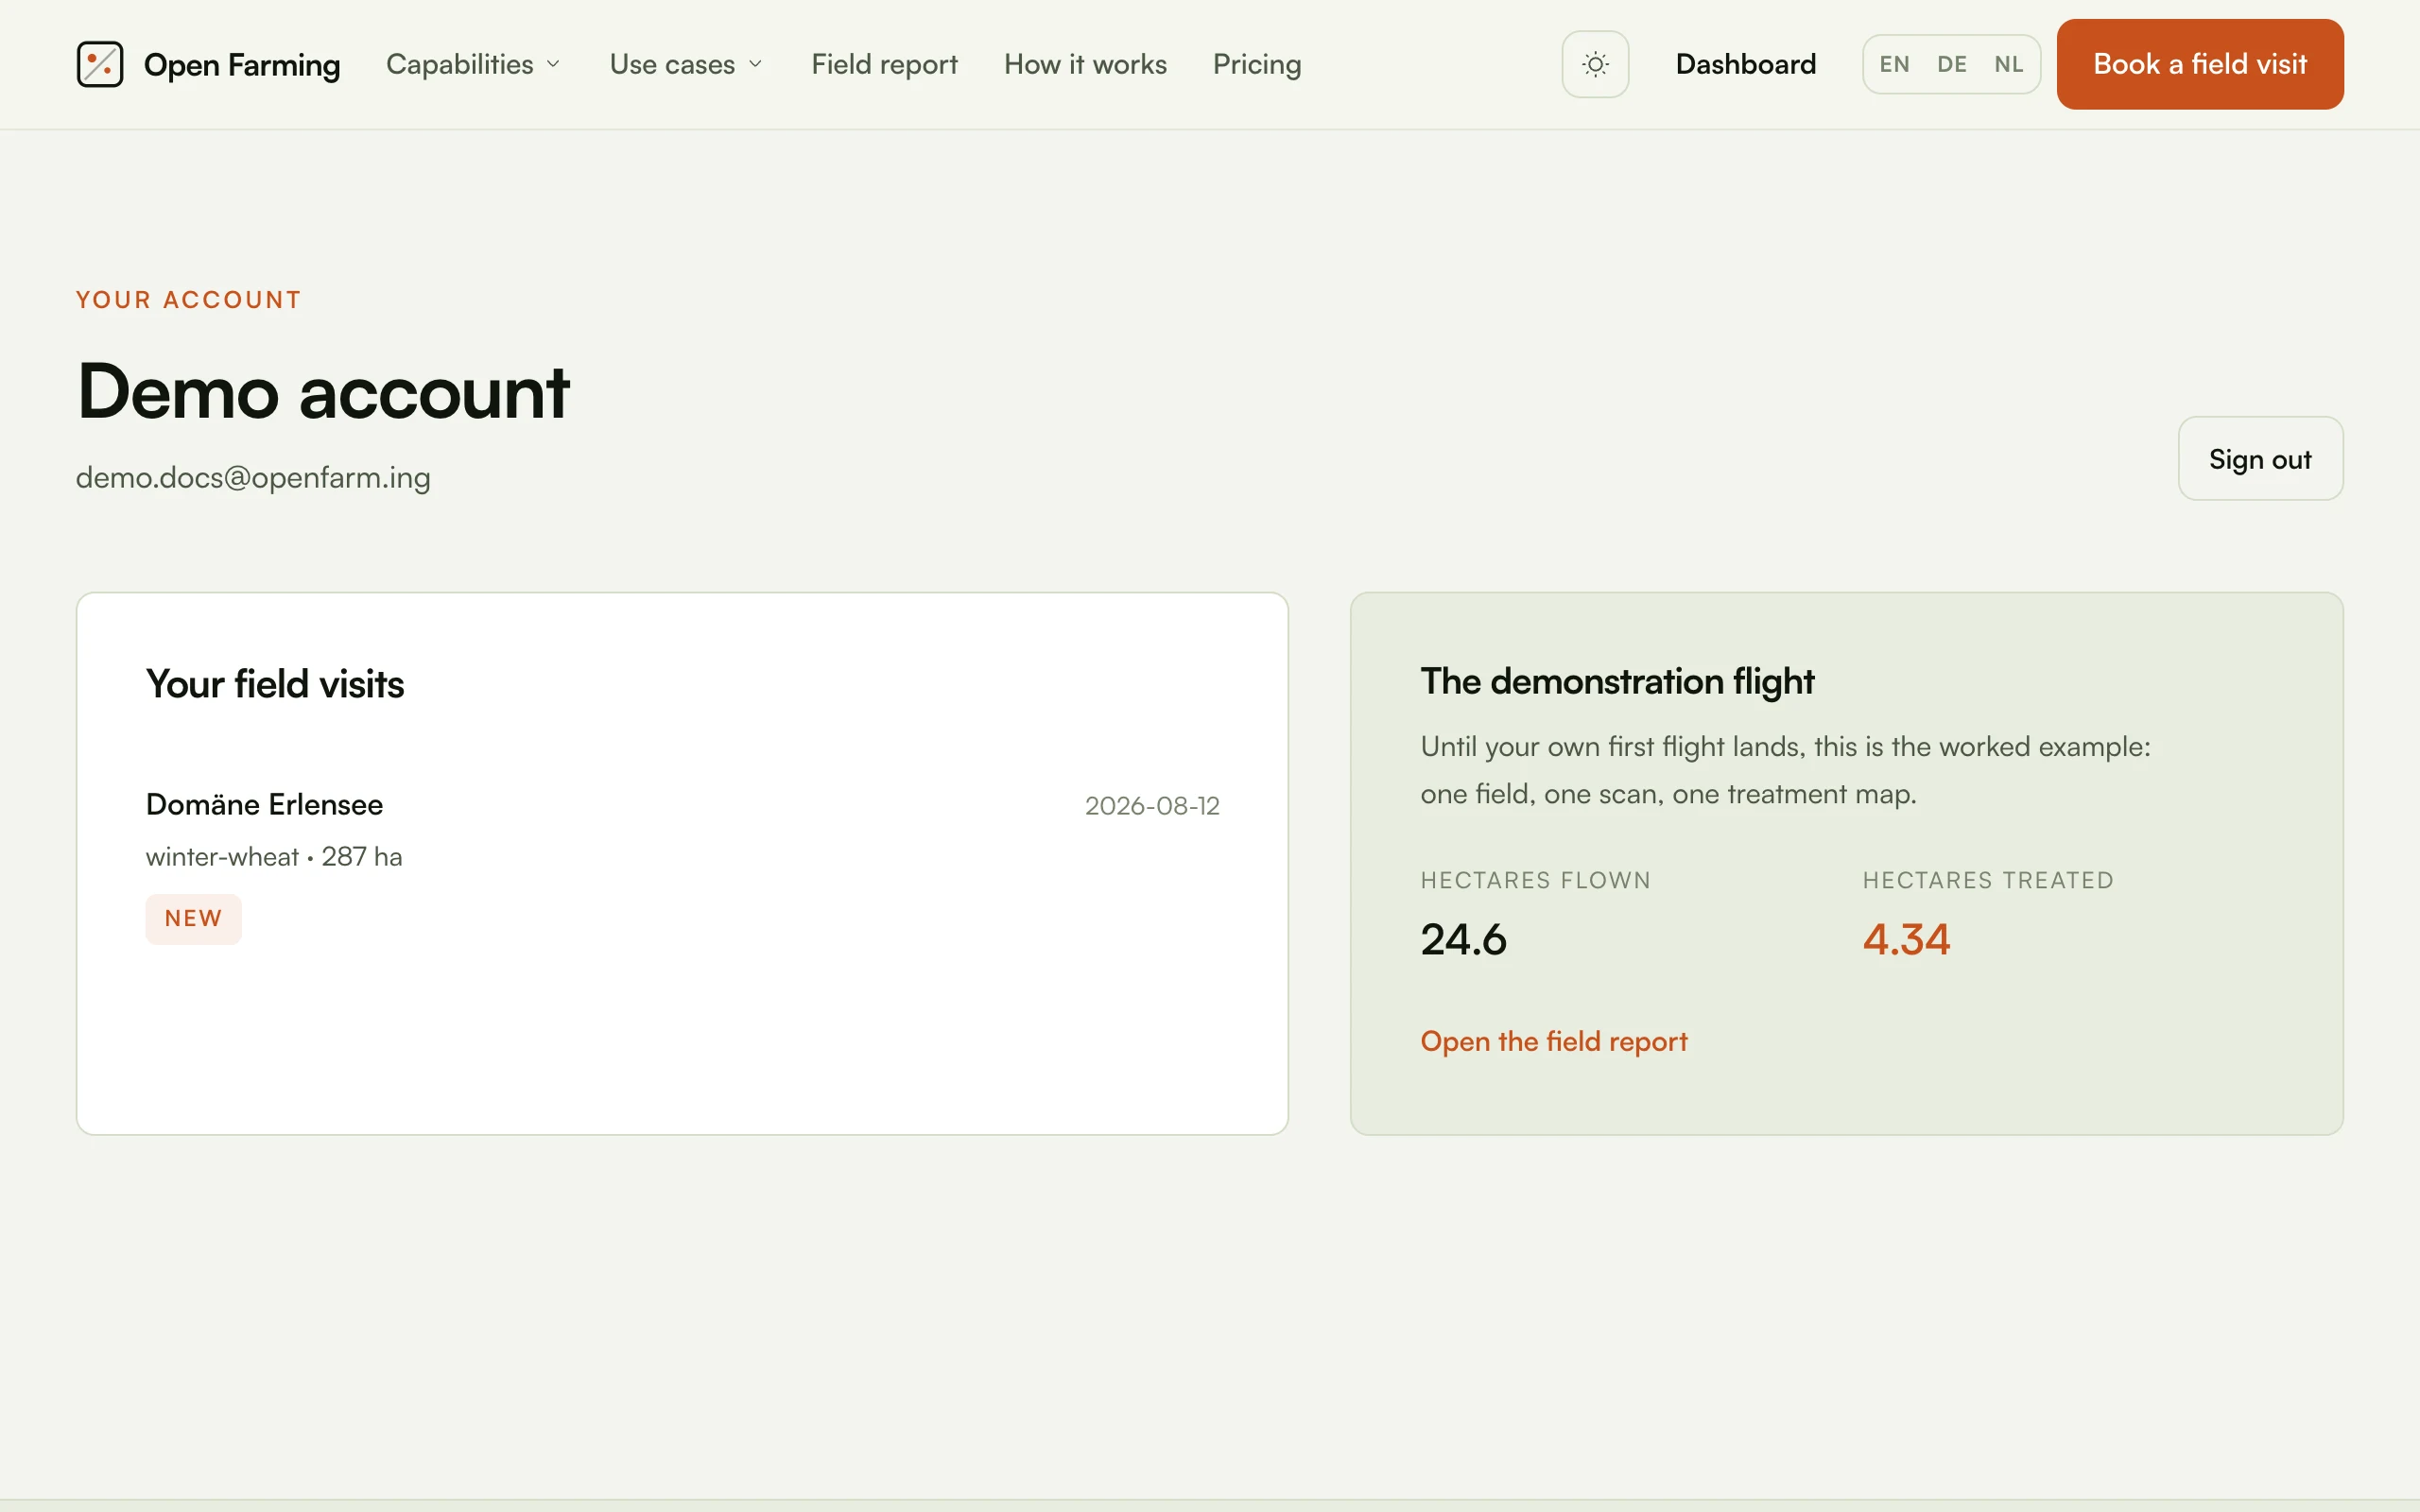
The visits a farmer has booked, joined by email so an enquiry made before signing up still belongs to them afterwards, and the demonstration flight as the worked example until their own first flight lands.
Regenerating these
./buddy serve --port 3311./buddy docs:screenshots --email demo@openfarm.ing --password '…'app/Commands/DocsScreenshots.ts drives headless Chrome over the DevTools
Protocol, signs itself in, and writes WebP at 2x into
docs/public/screenshots/. The shot list lives in that file; adding a page to
it puts the image on disk, and the caption is then written by hand, because a
caption is the part worth thinking about.
Point it at a development database, never at production: the console shots contain whatever the account can see.