Cooperatives and large estates
One picture across every member holding
Fleet coverage across scattered blocks, comparable numbers between holdings, and reporting that rolls up cleanly.
2,000 to 40,000 hectares across scattered member blocks.
Book a field visit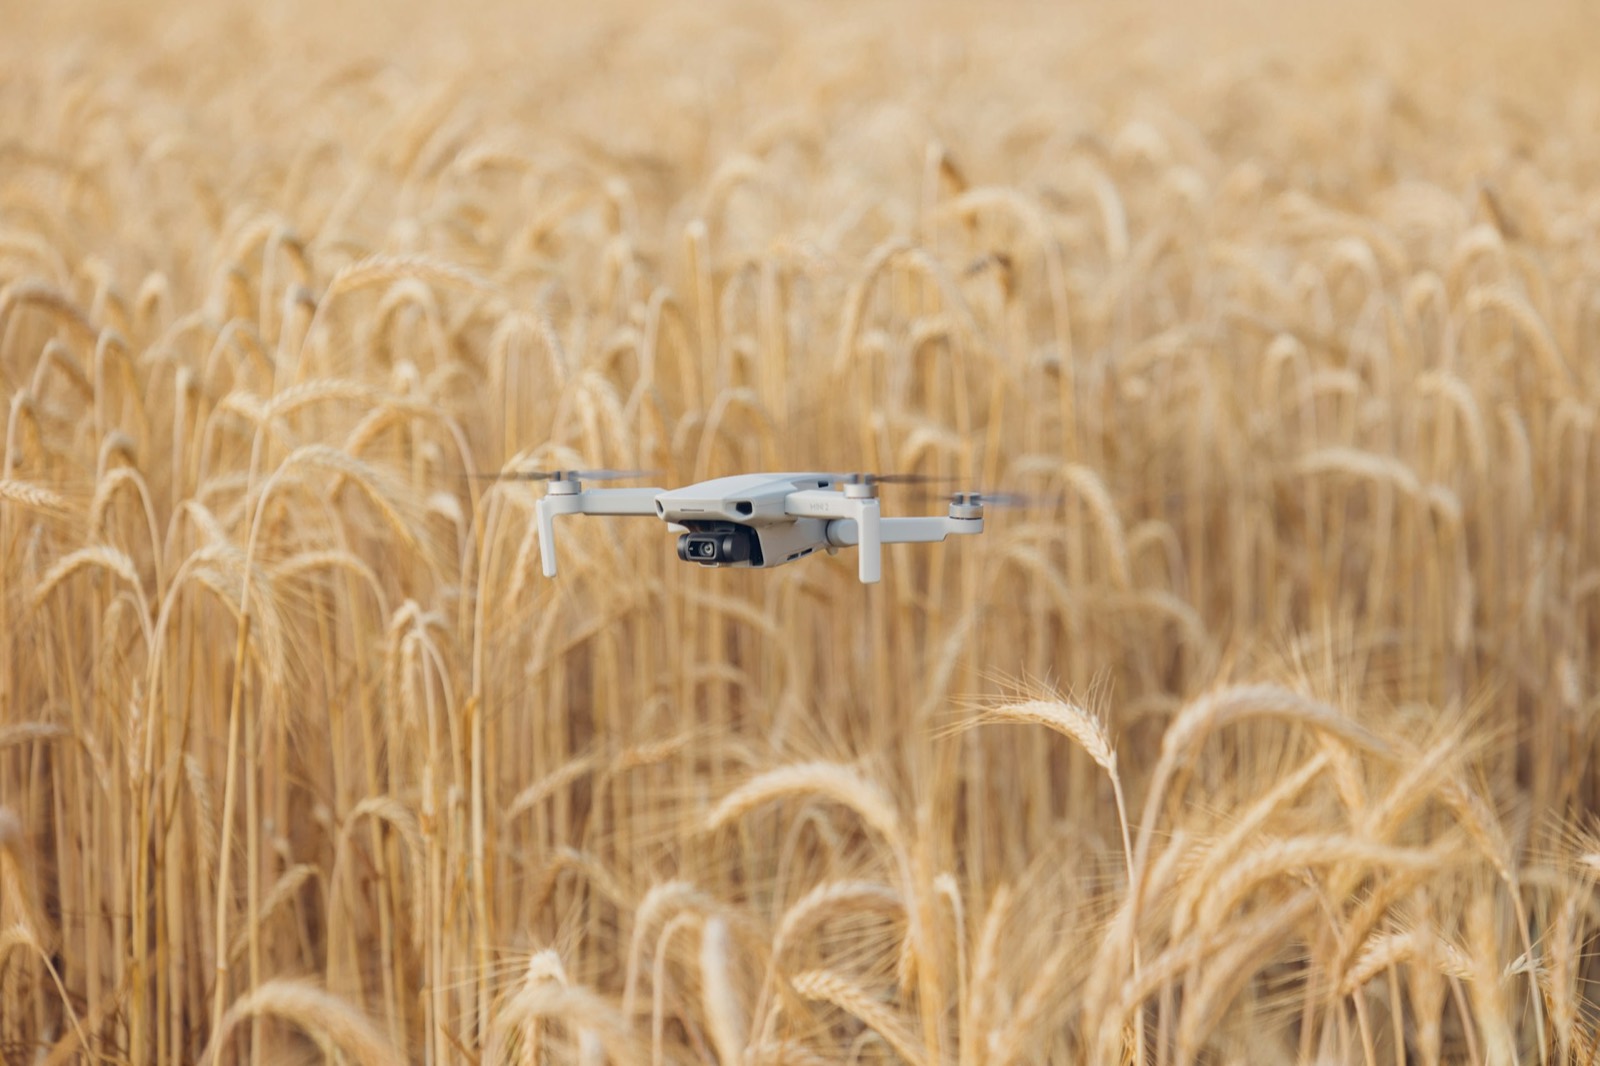
What actually goes wrong
A cooperative or a large estate has the same problem repeated dozens of times, plus one of its own: nothing is comparable. Each holding records differently, applies differently and reports differently, so an aggregate figure is either unavailable or not defensible. The blocks are scattered, which makes a pilot in a van an expensive way to cover them.
How we set it up
Docked aircraft placed to cover clusters of blocks, flying a schedule instead of a route driven by travel time. Every holding is measured the same way, so member comparison and benchmarking are meaningful. Reporting rolls up from field to holding to enterprise with the source flight still attached to each figure.
The flight calendar across a season
-
Base mapping across every member block and a shared field register.
-
Scheduled coverage from docks, with a published weekly calendar.
-
Prescriptions distributed to each holding's machines.
-
Yield estimates aggregated for the marketing and logistics plan.
-
Input, water and treated area reporting rolled up with evidence.
Capabilities in play, in order of how much they carry
-
Autonomous drone network
Docked, charged, and out again at first light
Drones launch from charging stations on their own schedule, cover the fields and dock again without a driver.
-
Flights as a service
Book the flights, not the aircraft
You book a scouting schedule and get analysis and recommendations. We own the drones, the pilots and the paperwork.
-
Sustainability reporting
The paperwork writes itself from the flights
Flight data, weather, soil and machine records combine into the input and water figures your buyers and schemes ask for.
-
Field decision assistant
A recommendation, not another image folder
The assistant reads every layer for a field and answers in plain language: what is wrong, where, and by when.
-
Precision fertilisation
Feed the rows that are short
The system works out which parts of the crop are under-supplied and builds a variable rate map for the spreader.
-
Yield forecasting
Count what is actually out there
Drones count plants, fruit or ears and turn the counts into a yield estimate for each part of the field.
What you end up with
Recorded on your fields, flight by flight. Not a projection.
- Every holding measured the same way, so comparison means something
- Coverage set by schedule rather than by driving distance
- Aggregate reporting with the source flight attached to each figure
- Marketing and logistics planned from estimates that update weekly
More in Operators